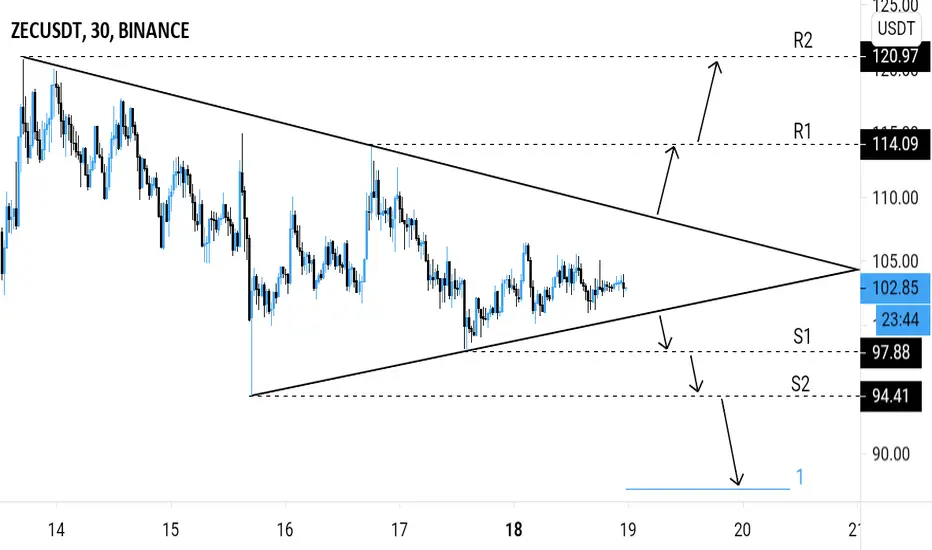
Analysis 🔎: ZENUSDT is consolidating in a symmetrical triangle pattern.
Breakout is imminent.
Bullish ⬆️: breakout above the symmetrical triangle's inclined resistance.
Bearish ⬇️: breakdown below the symmetrical triangle's inclined support.
Possible breakout price actions are indicated by the arrows on the chart.
Targets 🎯: Bullish ⬆️ - horizontal resistance levels (R1, R2).
Bearish ⬇️ - horizontal support levels (S1, S2), fibonacci extension levels.
면책사항
이 정보와 게시물은 TradingView에서 제공하거나 보증하는 금융, 투자, 거래 또는 기타 유형의 조언이나 권고 사항을 의미하거나 구성하지 않습니다. 자세한 내용은 이용 약관을 참고하세요.
면책사항
이 정보와 게시물은 TradingView에서 제공하거나 보증하는 금융, 투자, 거래 또는 기타 유형의 조언이나 권고 사항을 의미하거나 구성하지 않습니다. 자세한 내용은 이용 약관을 참고하세요.