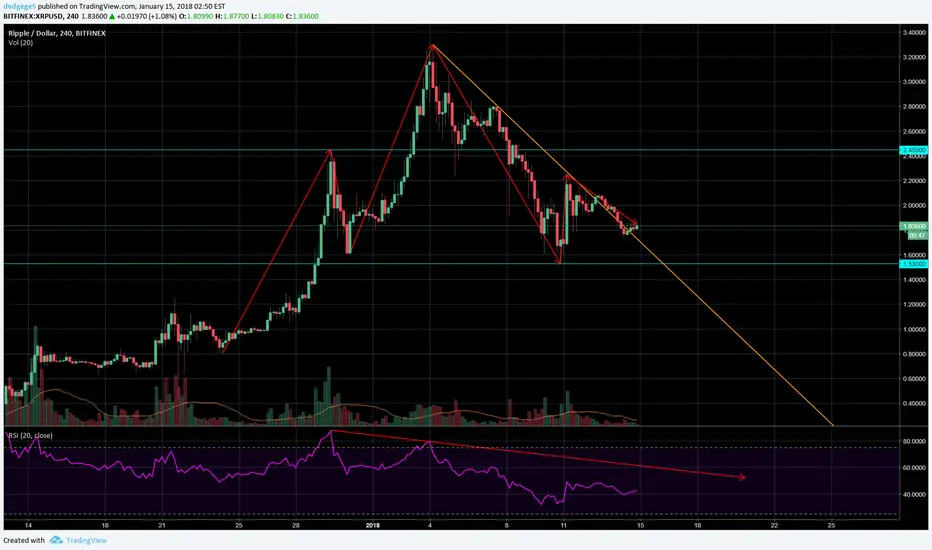
XRP has been bearish overall since its ATH 10 days ago. It hasn't managed a strong breakout from the trend (orange line), and volume has been very low. RSI showed bearish divergence at the peak.
Furthermore, XRP has also formed a head-and-shoulders pattern, meaning that it could see prices drop even further.
Currently hovering around $1.84, the direction that the price goes next will be very telling:
Furthermore, XRP has also formed a head-and-shoulders pattern, meaning that it could see prices drop even further.
Currently hovering around $1.84, the direction that the price goes next will be very telling:
- If the price continues downwards, and breaks $1.50 (previous low), then we will see the completion of the head and shoulders pattern, and a strong bearish signal.
- If it bounces off $1.50, forming a double-bottom pattern, giving a bullish signal.
- Lastly, it may break the current bearish trend altogether - but for this to happen, volume needs to pick up drastically. Watch for RSI to also break the bearish divergence trend line.
노트
So for now, the trend continues. $1.50 was hit but not broken through convincingly.
노트
In the previous update I used XRPUSDT on Bittrex instead of XRPUSD on Bitfinex. Oops. The prices are very similar, though, and I'll update again with XRPUSD soon.A look at XRPBTC. A similar H&S pattern. The previous "shoulder" was hit.
노트
XRPUSD on Bitfinex again. $1.10 soon?
노트
XRPBTC: the old support becomes the new resistance? Without a convincing breakout here, XRPBTC could be headed down even further
노트
XRPUSD: still following the orange line
노트
XRP looking much better today with a convincing trend break while BTC recovers as well. However, if BTC crashes further, XRP will follow suit, or at best, go sideways.
노트
XRPBTC is inching closer to EMA50 and EMA200 death cross and as BTCUSD drops, XRPBTC is dropping along with it. Do not take a long position if you believe BTCUSD will drop even further.
노트
XRPBTC is dancing around 12k, which was a previous support. Some more news of partnerships can potentially give it a much needed boost.
노트
down we go again
면책사항
이 정보와 게시물은 TradingView에서 제공하거나 보증하는 금융, 투자, 거래 또는 기타 유형의 조언이나 권고 사항을 의미하거나 구성하지 않습니다. 자세한 내용은 이용 약관을 참고하세요.
면책사항
이 정보와 게시물은 TradingView에서 제공하거나 보증하는 금융, 투자, 거래 또는 기타 유형의 조언이나 권고 사항을 의미하거나 구성하지 않습니다. 자세한 내용은 이용 약관을 참고하세요.