Trend Analysis
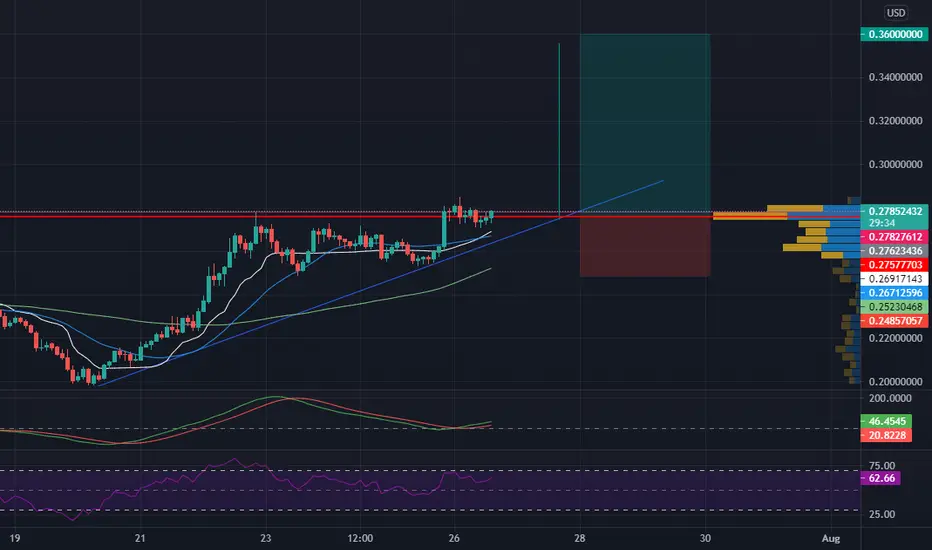
The main view of this trade idea is on the 2-Hour. Stellar (XLM) appears to be in an ascending triangle setup as illustrated in the chart. After finding support around the 0.20 price level the cryptocurrency is now 38.6% higher at the time of publishing, facing resistance around 0.275 zone. As per chart pattern analytics, if XLM pattern were to be completed, the cryptocurrency will rally towards 0.36.
Technical Indicators
XLM’s bullish chart pattern is complemented by the cryptocurrency being above its short (25-SMA), medium (75-SMA) and fractal moving averages. Moreover, there has been a positive crossover on the KST. The RSI is trading above 50 which is a bullish sign.
Recommendation
The recommendation will be to go long at market. XLM’s target price is around the 0.36 price level and its indicative stop loss is around the 0.253 level, near the higher low. This produces a risk-reward ratio of 3.03.
Disclaimer
The views expressed are mine and do not represent the views of my employers and business partners. Persons acting on these recommendations are doing so at their own risk. These recommendations are not a solicitation to buy or to sell but are for purely discussion purposes. At the time publishing, I have a position in xlm.
거래청산: 스탑 닿음
Close: stop reached면책사항
해당 정보와 게시물은 금융, 투자, 트레이딩 또는 기타 유형의 조언이나 권장 사항으로 간주되지 않으며, 트레이딩뷰에서 제공하거나 보증하는 것이 아닙니다. 자세한 내용은 이용 약관을 참조하세요.
면책사항
해당 정보와 게시물은 금융, 투자, 트레이딩 또는 기타 유형의 조언이나 권장 사항으로 간주되지 않으며, 트레이딩뷰에서 제공하거나 보증하는 것이 아닙니다. 자세한 내용은 이용 약관을 참조하세요.