If you think I will say that XLM will pump soon you are wrong. I have nothing to say about that coin. But it has several triangles that look really nice and I want to show them to you. First look at weekly chart.

Than go closer to day chart. Another triangle and trendlines prices is listenning to.

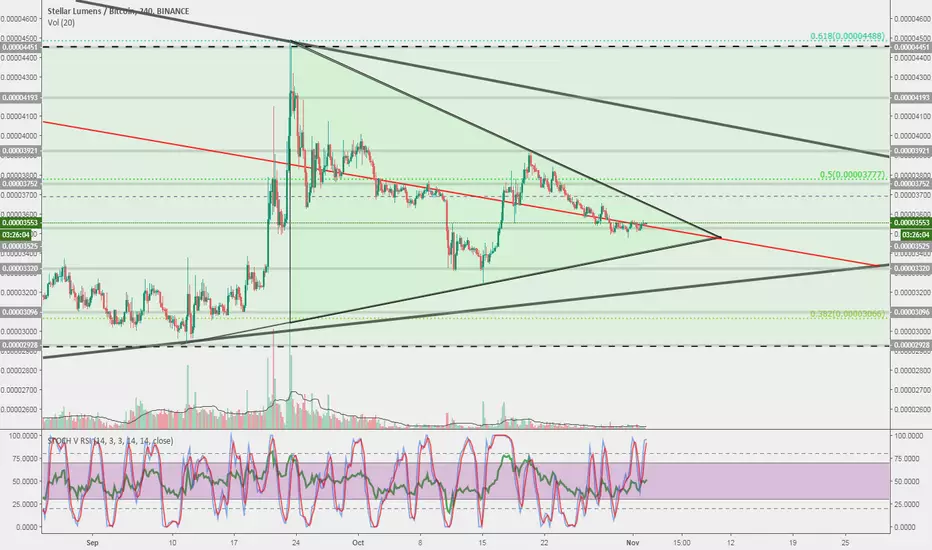
And finally 4 gour chart. Look how the red trendline plays all the way till the corner of our small triangle. That is not a coincidence. It will play its role either for the dump or pump of the price. And it will be seen very clear as it happens.

XLM is not a pumping coin but as you see the channels on my chart you can trade between them and be very happy with guaranteed results.
Good luck with your trades! Push like if you like my work. It will help me.
Than go closer to day chart. Another triangle and trendlines prices is listenning to.
And finally 4 gour chart. Look how the red trendline plays all the way till the corner of our small triangle. That is not a coincidence. It will play its role either for the dump or pump of the price. And it will be seen very clear as it happens.
XLM is not a pumping coin but as you see the channels on my chart you can trade between them and be very happy with guaranteed results.
Good luck with your trades! Push like if you like my work. It will help me.
노트
Clear breakout. Heading towards 390노트
Depth show large walls and the price is coming near the border. Probably it will breakout. Maybe not. Watching.노트
XLM is above the last triangle. Pick up at 4190-4200노트
My initial drawings still work as SR lines.FREE telegram channels:
Crypto reviews - t.me/WiseAnalyze
Crypto chat - t.me/WiseAnalyzeChat
Crypto watchlist - t.me/WiseAnalyzeDCA
Forex/Stocks - t.me/WiseForex
Crypto reviews - t.me/WiseAnalyze
Crypto chat - t.me/WiseAnalyzeChat
Crypto watchlist - t.me/WiseAnalyzeDCA
Forex/Stocks - t.me/WiseForex
면책사항
해당 정보와 게시물은 금융, 투자, 트레이딩 또는 기타 유형의 조언이나 권장 사항으로 간주되지 않으며, 트레이딩뷰에서 제공하거나 보증하는 것이 아닙니다. 자세한 내용은 이용 약관을 참조하세요.
FREE telegram channels:
Crypto reviews - t.me/WiseAnalyze
Crypto chat - t.me/WiseAnalyzeChat
Crypto watchlist - t.me/WiseAnalyzeDCA
Forex/Stocks - t.me/WiseForex
Crypto reviews - t.me/WiseAnalyze
Crypto chat - t.me/WiseAnalyzeChat
Crypto watchlist - t.me/WiseAnalyzeDCA
Forex/Stocks - t.me/WiseForex
면책사항
해당 정보와 게시물은 금융, 투자, 트레이딩 또는 기타 유형의 조언이나 권장 사항으로 간주되지 않으며, 트레이딩뷰에서 제공하거나 보증하는 것이 아닙니다. 자세한 내용은 이용 약관을 참조하세요.