Another good week last week wit over 600 pips profit from the buy and sell levels.
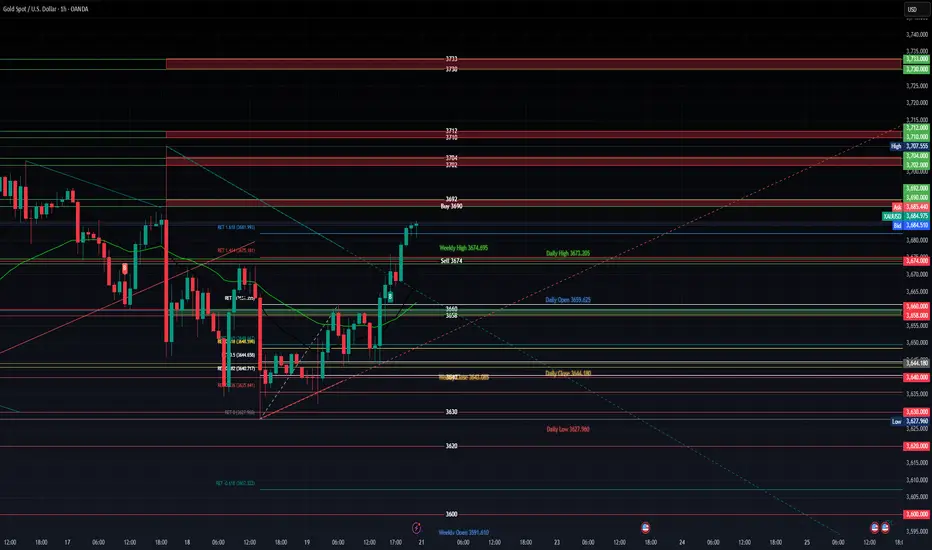
This week am looking to take buy at 3690, and a break of 3692 should contimue upwards until the next resistance at 3672/74 area.
personally i think we are due a correction its just a matter of how high can we go before that happens.
Follow the levals upwards noteing resistances at key levels.
On the sell side ill look at entering at 3674 , a break of 3672/70 would signal a further downward trend,
key levels to watch at 3660/58 which will be strong support.
Ill update this chart as the week progresses .
Until then trade safe use approprate lots sizes and proper risk.
액티브 트레이드
Buy running 385 pips거래청산: 타겟 닿음
587 pips on the buy another great start to the week
관련 발행물
면책사항
이 정보와 게시물은 TradingView에서 제공하거나 보증하는 금융, 투자, 거래 또는 기타 유형의 조언이나 권고 사항을 의미하거나 구성하지 않습니다. 자세한 내용은 이용 약관을 참고하세요.
관련 발행물
면책사항
이 정보와 게시물은 TradingView에서 제공하거나 보증하는 금융, 투자, 거래 또는 기타 유형의 조언이나 권고 사항을 의미하거나 구성하지 않습니다. 자세한 내용은 이용 약관을 참고하세요.