Check out last weeks chart , I closed with 600 pips but the buy ran for over 1300 pips
## XAUUSD 1-Hour Chart Analysis (Context: Late September/Early October)
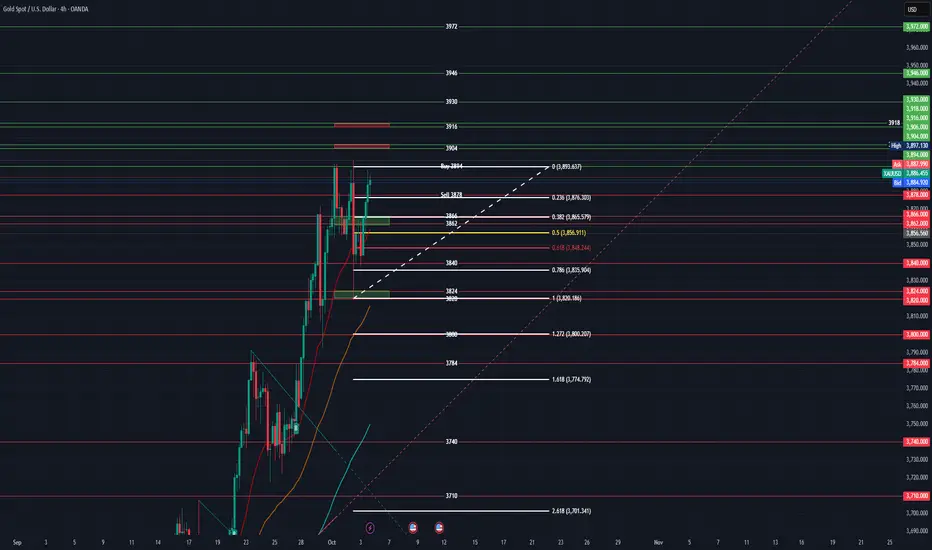
The chart displays a clear **uptrend** leading into the marked entries, characterized by higher highs and higher lows, and price generally holding above the moving averages (the white and green lines). The current price action (as of the last visible bar on October 3rd/4th) shows some consolidation after hitting near the `Daily High 3897.130`.
### Key Technical Observations
1. **Trend:** Strongly bullish preceding the current consolidation.
2. **Levels:**
* The price is currently hovering between the recent swing high/Daily High and the previous day's open/close levels.
* The Fibonacci retracement (drawn from a recent swing low to the subsequent high) is prominent. The 50% level (`3855.926`) and the $0.618$ level (`3847.491`) are key potential support areas.
3. **Volume/Delta:** The chart indicates a "Macro Delta Volume" of 6.66% and "Premium/Discount" zones, suggesting the use of Order Flow or Volume Profile analysis, which generally confirms the bullish pressure leading up to the high.
### Analysis of Marked Entries
I have marked two entries based on a potential range breakout strategy:
* **Buy Entry:** `Buy 3894`
* **Sell Entry:** `Sell 3878`
These entries appear to be attempting to trade a **range breakout** or **breakdown** from the current consolidation zone. The area between 3878 and 3894 is likely the immediate trading range you are observing.
#### 1. Buy Entry: `Buy 3894`
* **Context:** This is placed just below the recent high (`Daily High 3897.130`) and the premium zone, aiming for a continuation of the prior strong uptrend.
* **Success Conditions:** Requires buyers to overcome the resistance at the recent high and push into new territory (potentially targeting `3900`, `3904`, or higher resistance at `3916`).
* **Probability Assessment:**
* **Pro:** The overall trend is bullish. Breaking the recent high suggests strong demand continuation.
* **Con:** The price has just experienced a significant move up and might be due for a deeper retracement (a "pullback" to the Daily Open or 50% Fib level) before breaking out. A breakout immediately after a large run can sometimes be a false breakout (a "trap").
* **Probability:** **Medium (50-60%)**. The success relies heavily on sustained momentum and failing to print a deeper retracement first. Aggressive buying pressure would be required to trigger this.
#### 2. Sell Entry: `Sell 3878`
* **Context:** This entry targets a breakdown below the immediate support of the current consolidation range, indicating a potential reversal or a bearish move toward key support levels (like the Fib levels or the Daily Low).
* **Success Conditions:** Requires sellers to push price past 3878, confirming the consolidation is resolving downward, likely targeting the Daily Open (`3864`) or the 50% Fibonacci retracement (`3856`).
* **Probability Assessment:**
* **Pro:** The strong momentum upward has paused, suggesting selling pressure might be starting to emerge. A move below 3878 validates a short-term bearish reversal or a deeper pullback.
* **Con:** The long-term trend remains strongly bullish. Selling into a strong trend, even for a pullback, is inherently riskier. The lower support structure (Fib levels) is generally robust in a bullish market.
* **Probability:** **Medium-High (55-65%)**. A retracement to the 50-61.8% Fib levels is a highly common and statistically probable event after a significant impulse move. If 3878 breaks, the road to 3864/3856 is quite clear.
---
1. **The Sell setup at 3878 has a slightly higher immediate probability** because pullbacks/retracements are common and expected after a large move, and a break below 3878 would signify the start of such a move.
2. **The Buy setup at 3894 offers greater reward potential** if the major trend continuation occurs, but it faces the immediate hurdle of the recent high and potential exhaustion.
**Risk Management Note:** For either trade, a failure to follow through quickly (i.e., if the price lingers around the entry level) should be a sign of caution.
---
## Look Ahead: Economic News and Impact on Gold (XAUUSD)
Assuming the current chart data is from early October (based on the time stamps), the focus for the coming week will be on the US Dollar (USD) strength, which is inversely correlated with the price of Gold, and overall risk sentiment.
Gold is highly sensitive to:
1. **Interest Rate Expectations:** Higher rates increase the opportunity cost of holding non-yielding Gold.
2. **Inflation/Economic Data:** Poor data often boosts Gold as a safe-haven asset, while strong data often boosts the USD (hurting Gold).
### Key Economic Events and Potential Impact (Hypothetical Oct Week)
| Event Category | Potential News | Usual Impact on USD | Probable Impact on XAUUSD |
| :--- | :--- | :--- | :--- |
| **Inflation/Rates** | FOMC Meeting Minutes / Speeches from Federal Reserve Members (Hawkish commentary) | Stronger USD | **Negative.** Confirms a "higher for longer" rate view, pressuring Gold. |
| **Employment** | US Non-Farm Payrolls (NFP) or Initial Jobless Claims (Strong report) | Stronger USD | **Negative.** Strong job market reduces recession fears and allows the Fed to remain tight. |
| **Manufacturing** | ISM PMI Data (Better than expected) | Stronger USD | **Negative.** Suggests economic resilience, supporting US assets over safe havens. |
| **Risk Sentiment** | Geopolitical Shocks or Banking Sector Instability | Weaker USD (as capital flows to safety) | **Positive.** Gold acts as the primary safe-haven asset during times of high uncertainty. |
**Overall Expected Bias:** Given the recent momentum in the chart, if the week's economic data (especially jobs/inflation) comes in *strong* or *as expected (hawkish)*, it will likely lead to **USD strength**, pushing Gold from its recent highs and favoring your **Sell 3878** scenario (at least as a deeper retracement).
If the data is **significantly poorer** than expected, or a major external risk event occurs, this would fuel USD weakness and boost Gold, favoring your **Buy 3894** scenario for a strong bullish continuation.
## XAUUSD 1-Hour Chart Analysis (Context: Late September/Early October)
The chart displays a clear **uptrend** leading into the marked entries, characterized by higher highs and higher lows, and price generally holding above the moving averages (the white and green lines). The current price action (as of the last visible bar on October 3rd/4th) shows some consolidation after hitting near the `Daily High 3897.130`.
### Key Technical Observations
1. **Trend:** Strongly bullish preceding the current consolidation.
2. **Levels:**
* The price is currently hovering between the recent swing high/Daily High and the previous day's open/close levels.
* The Fibonacci retracement (drawn from a recent swing low to the subsequent high) is prominent. The 50% level (`3855.926`) and the $0.618$ level (`3847.491`) are key potential support areas.
3. **Volume/Delta:** The chart indicates a "Macro Delta Volume" of 6.66% and "Premium/Discount" zones, suggesting the use of Order Flow or Volume Profile analysis, which generally confirms the bullish pressure leading up to the high.
### Analysis of Marked Entries
I have marked two entries based on a potential range breakout strategy:
* **Buy Entry:** `Buy 3894`
* **Sell Entry:** `Sell 3878`
These entries appear to be attempting to trade a **range breakout** or **breakdown** from the current consolidation zone. The area between 3878 and 3894 is likely the immediate trading range you are observing.
#### 1. Buy Entry: `Buy 3894`
* **Context:** This is placed just below the recent high (`Daily High 3897.130`) and the premium zone, aiming for a continuation of the prior strong uptrend.
* **Success Conditions:** Requires buyers to overcome the resistance at the recent high and push into new territory (potentially targeting `3900`, `3904`, or higher resistance at `3916`).
* **Probability Assessment:**
* **Pro:** The overall trend is bullish. Breaking the recent high suggests strong demand continuation.
* **Con:** The price has just experienced a significant move up and might be due for a deeper retracement (a "pullback" to the Daily Open or 50% Fib level) before breaking out. A breakout immediately after a large run can sometimes be a false breakout (a "trap").
* **Probability:** **Medium (50-60%)**. The success relies heavily on sustained momentum and failing to print a deeper retracement first. Aggressive buying pressure would be required to trigger this.
#### 2. Sell Entry: `Sell 3878`
* **Context:** This entry targets a breakdown below the immediate support of the current consolidation range, indicating a potential reversal or a bearish move toward key support levels (like the Fib levels or the Daily Low).
* **Success Conditions:** Requires sellers to push price past 3878, confirming the consolidation is resolving downward, likely targeting the Daily Open (`3864`) or the 50% Fibonacci retracement (`3856`).
* **Probability Assessment:**
* **Pro:** The strong momentum upward has paused, suggesting selling pressure might be starting to emerge. A move below 3878 validates a short-term bearish reversal or a deeper pullback.
* **Con:** The long-term trend remains strongly bullish. Selling into a strong trend, even for a pullback, is inherently riskier. The lower support structure (Fib levels) is generally robust in a bullish market.
* **Probability:** **Medium-High (55-65%)**. A retracement to the 50-61.8% Fib levels is a highly common and statistically probable event after a significant impulse move. If 3878 breaks, the road to 3864/3856 is quite clear.
---
1. **The Sell setup at 3878 has a slightly higher immediate probability** because pullbacks/retracements are common and expected after a large move, and a break below 3878 would signify the start of such a move.
2. **The Buy setup at 3894 offers greater reward potential** if the major trend continuation occurs, but it faces the immediate hurdle of the recent high and potential exhaustion.
**Risk Management Note:** For either trade, a failure to follow through quickly (i.e., if the price lingers around the entry level) should be a sign of caution.
---
## Look Ahead: Economic News and Impact on Gold (XAUUSD)
Assuming the current chart data is from early October (based on the time stamps), the focus for the coming week will be on the US Dollar (USD) strength, which is inversely correlated with the price of Gold, and overall risk sentiment.
Gold is highly sensitive to:
1. **Interest Rate Expectations:** Higher rates increase the opportunity cost of holding non-yielding Gold.
2. **Inflation/Economic Data:** Poor data often boosts Gold as a safe-haven asset, while strong data often boosts the USD (hurting Gold).
### Key Economic Events and Potential Impact (Hypothetical Oct Week)
| Event Category | Potential News | Usual Impact on USD | Probable Impact on XAUUSD |
| :--- | :--- | :--- | :--- |
| **Inflation/Rates** | FOMC Meeting Minutes / Speeches from Federal Reserve Members (Hawkish commentary) | Stronger USD | **Negative.** Confirms a "higher for longer" rate view, pressuring Gold. |
| **Employment** | US Non-Farm Payrolls (NFP) or Initial Jobless Claims (Strong report) | Stronger USD | **Negative.** Strong job market reduces recession fears and allows the Fed to remain tight. |
| **Manufacturing** | ISM PMI Data (Better than expected) | Stronger USD | **Negative.** Suggests economic resilience, supporting US assets over safe havens. |
| **Risk Sentiment** | Geopolitical Shocks or Banking Sector Instability | Weaker USD (as capital flows to safety) | **Positive.** Gold acts as the primary safe-haven asset during times of high uncertainty. |
**Overall Expected Bias:** Given the recent momentum in the chart, if the week's economic data (especially jobs/inflation) comes in *strong* or *as expected (hawkish)*, it will likely lead to **USD strength**, pushing Gold from its recent highs and favoring your **Sell 3878** scenario (at least as a deeper retracement).
If the data is **significantly poorer** than expected, or a major external risk event occurs, this would fuel USD weakness and boost Gold, favoring your **Buy 3894** scenario for a strong bullish continuation.
액티브 트레이드
Another great start for the weekRan 522 pips from the buy
3936 needs to break to continue
거래청산: 타겟 닿음
930 pips closed out from the buy back sunday with another관련 발행물
면책사항
이 정보와 게시물은 TradingView에서 제공하거나 보증하는 금융, 투자, 거래 또는 기타 유형의 조언이나 권고 사항을 의미하거나 구성하지 않습니다. 자세한 내용은 이용 약관을 참고하세요.
관련 발행물
면책사항
이 정보와 게시물은 TradingView에서 제공하거나 보증하는 금융, 투자, 거래 또는 기타 유형의 조언이나 권고 사항을 의미하거나 구성하지 않습니다. 자세한 내용은 이용 약관을 참고하세요.