WTI Crude Oil (1H) Chart Analysis with Emojis:
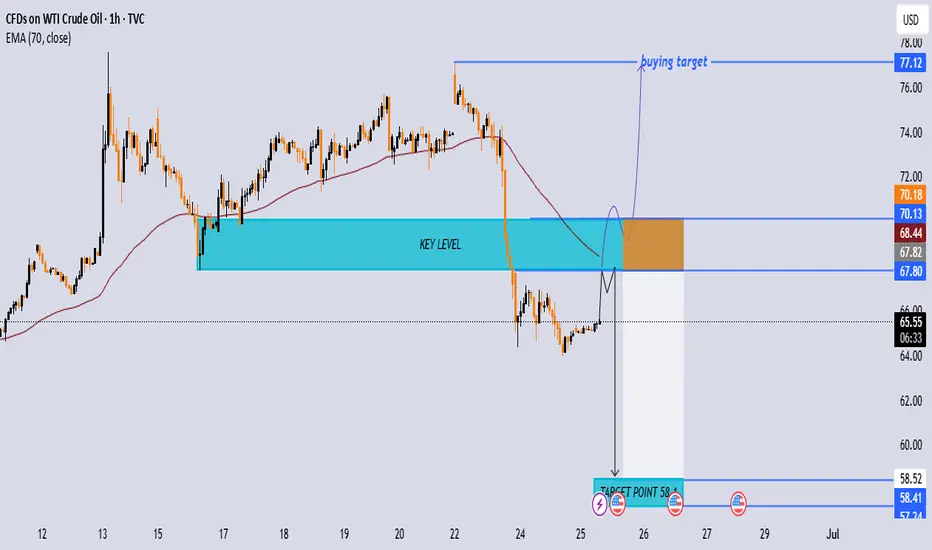
🔵 Key Level Zone (67.80 - 70.18 USD)
👉 Major decision area — 🔥 Watch for reaction!
⚠️ Potential for price rejection here.
🔻 Primary Bearish Scenario:
🔵 Price moves up to Key Level zone (Blue Box).
🔴 Red Dot — Entry for potential Sell if rejection confirmed.
🎯 Target Point: 58.1 USD marked with a 🎯 and 🔵 Blue Dot.
💡 Historical support zone here.
Alternate Bullish Scenario:
✅ Break above 70.18 USD with strong momentum.
🟢 Green Dot — Entry confirmation above resistance.
📈 Buying Target: 77.12 USD marked and 🔵 Blue Dot.
Key Indicators:
📏 EMA 70 (68.44 USD) — Dynamic resistance, price may react here.
👀 Price hovering below — indicating bearish bias unless broken.
Trade Tips:
✔️ Wait for rejection at Key Zone for sell setup 🔻.
✔️ Break & retest above 70.18 USD for potential buy setup 🔼.
✔️ Use stop-loss to manage risk.
join my tellegram channel
t.me/+yhY0QtYtM0g0NWM0
join my refferal broker
one.exnesstrack.org/a/g565sj1uo7?source=app
t.me/+yhY0QtYtM0g0NWM0
join my refferal broker
one.exnesstrack.org/a/g565sj1uo7?source=app
관련 발행물
면책사항
이 정보와 게시물은 TradingView에서 제공하거나 보증하는 금융, 투자, 거래 또는 기타 유형의 조언이나 권고 사항을 의미하거나 구성하지 않습니다. 자세한 내용은 이용 약관을 참고하세요.