Technical Analysis Of WTI Crude Oil (4H Chart)
▪️Support/Resistance Levels
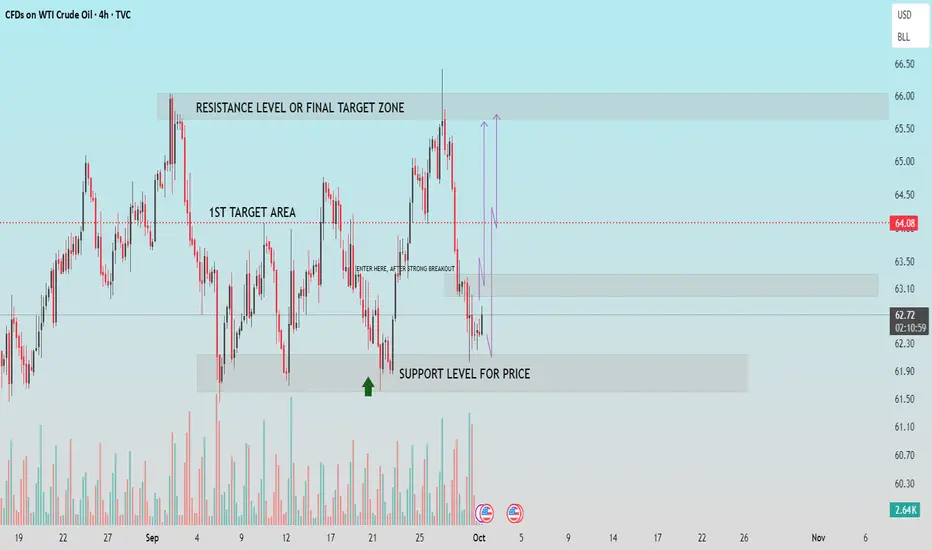
▫️Support Level
Zone: $61.50 – $62.30
Price has recently bounced from a strong support zone, which has previously acted as a demand area. A green arrow highlights this level, indicating a potential long setup if the support holds.
▫️First Target Area (Resistance/Reaction Zone)
Zone: $63.10 – $64.00
This is the first key resistance area. A breakout above this level confirms bullish strength and offers a short-term target for long positions.
▫️Final Target Zone / Major Resistance
Zone: $65.50 – $66.50
This upper resistance has rejected price multiple times in the past. If the price breaks above the first target area with strong momentum, this becomes the final target zone for bullish trades.
▪️Trade Setup Insight
▫️Entry Point: Suggested "Enter here, after strong breakout" indicates a breakout trading strategy above the first resistance zone ($63.10).
▫️Potential Move: Price action suggests a bullish impulse if support holds and momentum continues upward.
▫️Volume: Volume spikes around support indicate buying interest, further validating the bounce.
▪️Conclusion
Watch for a clean breakout above $63.10 with volume confirmation to target $65.50+. Caution advised if price breaks back below $62.30, which may invalidate the bullish outlook.
If this helpful for you, press the like button.
▪️Support/Resistance Levels
▫️Support Level
Zone: $61.50 – $62.30
Price has recently bounced from a strong support zone, which has previously acted as a demand area. A green arrow highlights this level, indicating a potential long setup if the support holds.
▫️First Target Area (Resistance/Reaction Zone)
Zone: $63.10 – $64.00
This is the first key resistance area. A breakout above this level confirms bullish strength and offers a short-term target for long positions.
▫️Final Target Zone / Major Resistance
Zone: $65.50 – $66.50
This upper resistance has rejected price multiple times in the past. If the price breaks above the first target area with strong momentum, this becomes the final target zone for bullish trades.
▪️Trade Setup Insight
▫️Entry Point: Suggested "Enter here, after strong breakout" indicates a breakout trading strategy above the first resistance zone ($63.10).
▫️Potential Move: Price action suggests a bullish impulse if support holds and momentum continues upward.
▫️Volume: Volume spikes around support indicate buying interest, further validating the bounce.
▪️Conclusion
Watch for a clean breakout above $63.10 with volume confirmation to target $65.50+. Caution advised if price breaks back below $62.30, which may invalidate the bullish outlook.
If this helpful for you, press the like button.
액티브 트레이드
거래청산: 스탑 닿음
💸FREE FOREX Signals in Telegram : t.me/FxInsightsHub0
🔹Join Our Telegram Channel, Pure Price Action Based Signals With Chart Analysis.
t.me/FxInsightsHub0
🚀FREE CRYPTO Signals In Telegram: t.me/FxInsightsHub0
🔹Join Our Telegram Channel, Pure Price Action Based Signals With Chart Analysis.
t.me/FxInsightsHub0
🚀FREE CRYPTO Signals In Telegram: t.me/FxInsightsHub0
관련 발행물
면책사항
이 정보와 게시물은 TradingView에서 제공하거나 보증하는 금융, 투자, 거래 또는 기타 유형의 조언이나 권고 사항을 의미하거나 구성하지 않습니다. 자세한 내용은 이용 약관을 참고하세요.