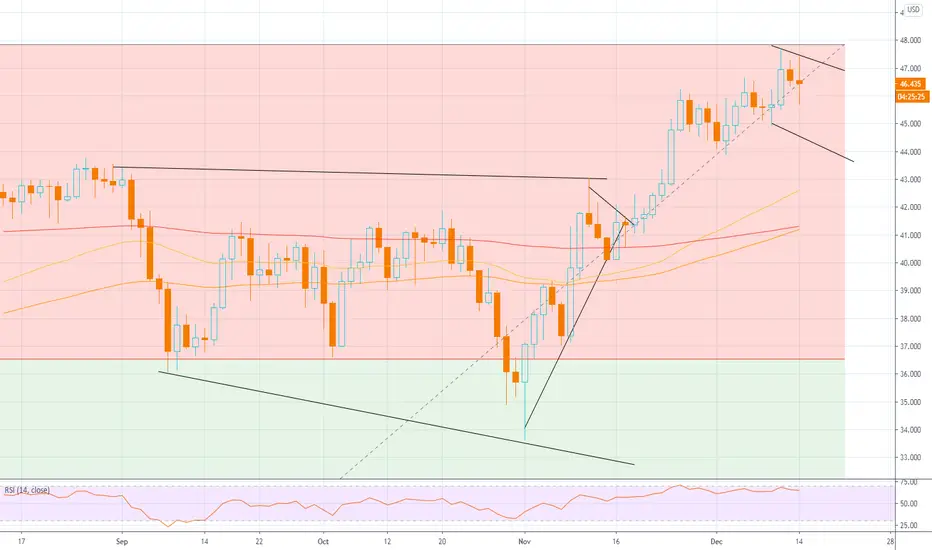
Possible Bull Flag now in play
Using 4 hr and Weekly
USO has come down a bit, offering traders and investors a chance to pick up Energy Equities or Oil itself at a discount to last week's nosebleed prices. Next hurdle if 47.84 is breached with strength, would be 51.23, which is the 200 W EMA when looking weekly chart. I should not be switching time frames, but we are now above the 200 Daily EMA, I'm going to call it legit. Not for the feint of heart this week. Prices can still go lower. I would consider 41.38 as absolutely critical last chance support on the Daily if the wheels come off in the next few weeks. Near-term support is 45.97 (50 EMA on the 4-hr). Distribution (selling) occurred at 47.40 which is at the top of the flag formation for today.
I am holding oil & gas equities, along with a leveraged oil ETF (bought at significantly lower prices) and I am not looking to sell, as these are all long-term holds. No interest in adding to the leveraged Oil ETF as it does not pay me, holding for above 50 at the least and I will see where it goes from there, long-term target could be as high as 70, but this could take months. I am using the RSI, and I am tracking what might be the hint of bearish divergence, but not on larger time-frames.
노트
노트
노트
USO does not appear to care either way, slowly rising - wondering if we hit 50 before Christmas holiday.노트
This is where going to a different timeframe can change your point of view, the oil rally while nice appears to be tapering off somewhat in it's bullishness > we might end up correcting soonish.노트
Drilling down to a 5 minute to observe the attempted breakout...Next couple of days will be interesting
면책사항
이 정보와 게시물은 TradingView에서 제공하거나 보증하는 금융, 투자, 거래 또는 기타 유형의 조언이나 권고 사항을 의미하거나 구성하지 않습니다. 자세한 내용은 이용 약관을 참고하세요.
면책사항
이 정보와 게시물은 TradingView에서 제공하거나 보증하는 금융, 투자, 거래 또는 기타 유형의 조언이나 권고 사항을 의미하거나 구성하지 않습니다. 자세한 내용은 이용 약관을 참고하세요.