Hey Realistic Traders!
Price action is weakening. Will USOIL find support or slide further?
Let’s Break It Down..
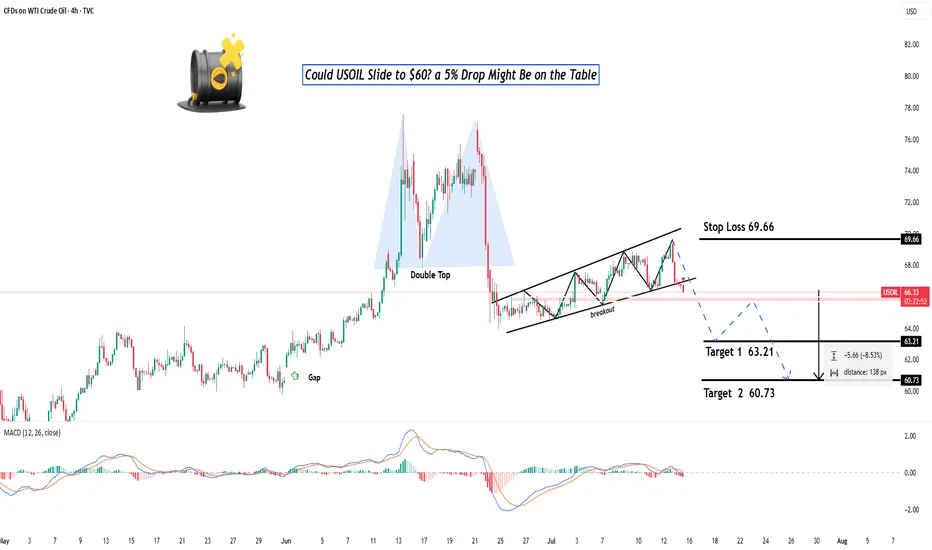
On the 4H timeframe, oil has formed a double top pattern followed by a neckline breakout, which is a classic sign of a potential shift from a bullish to a bearish trend.
This breakout was confirmed by a break below the bullish trendline, accompanied by consecutive bearish full-body candlesticks that reinforce the bearish momentum. Afterward, the price formed a bearish continuation pattern known as a rising wedge, which was followed by a breakdown.
The combination of bearish reversal and continuation pattern breakouts signals further downside movement and confirms the shift into a bearish trend.
Therefore, we foresee the price forming lower lows and lower highs toward the first target at 63.21, with a potential extension to the close the gap at 60.73.
The bearish outlook remains valid as long as the price stays below the key stop-loss level at 69.66.
Support the channel by engaging with the content, using the rocket button, and sharing your opinions in the comments below.
Disclaimer: This analysis is for educational purposes only and should not be considered a recommendation to take a long or short position on USOIL.
Price action is weakening. Will USOIL find support or slide further?
Let’s Break It Down..
On the 4H timeframe, oil has formed a double top pattern followed by a neckline breakout, which is a classic sign of a potential shift from a bullish to a bearish trend.
This breakout was confirmed by a break below the bullish trendline, accompanied by consecutive bearish full-body candlesticks that reinforce the bearish momentum. Afterward, the price formed a bearish continuation pattern known as a rising wedge, which was followed by a breakdown.
The combination of bearish reversal and continuation pattern breakouts signals further downside movement and confirms the shift into a bearish trend.
Therefore, we foresee the price forming lower lows and lower highs toward the first target at 63.21, with a potential extension to the close the gap at 60.73.
The bearish outlook remains valid as long as the price stays below the key stop-loss level at 69.66.
Support the channel by engaging with the content, using the rocket button, and sharing your opinions in the comments below.
Disclaimer: This analysis is for educational purposes only and should not be considered a recommendation to take a long or short position on USOIL.
액티브 트레이드
I still has conviction on the positionCandlestick formation formed a base, right below the lower trendline of the structure
Usually indicate a potential continuation of the bearish trend
관련 발행물
면책사항
이 정보와 게시물은 TradingView에서 제공하거나 보증하는 금융, 투자, 거래 또는 기타 유형의 조언이나 권고 사항을 의미하거나 구성하지 않습니다. 자세한 내용은 이용 약관을 참고하세요.
관련 발행물
면책사항
이 정보와 게시물은 TradingView에서 제공하거나 보증하는 금융, 투자, 거래 또는 기타 유형의 조언이나 권고 사항을 의미하거나 구성하지 않습니다. 자세한 내용은 이용 약관을 참고하세요.