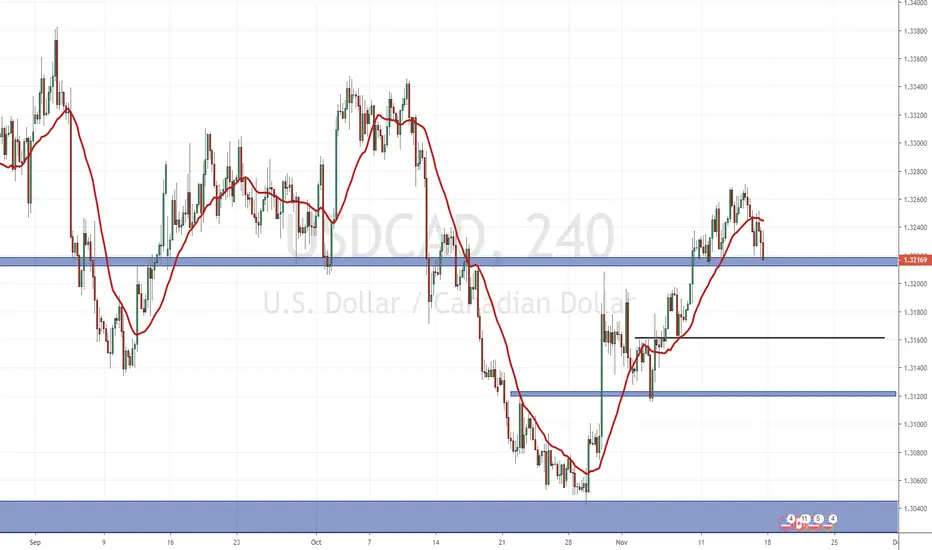
USDCAD on the 4 hour shows a nice uptrend composed of multiple waves (higher lows).
We then began to lose steam at around the 1.3270 zone which looking to the left, is close to a flip zone and supply zone.
You can see that we appear to have possibly made our first lower high which you can see close to my moving average, creating what looks like a head and shoulders pattern showing a transition from one trend to another.
However, we need lower lows to confirm a lower high. We are awaiting for this which requires a break and close below the 1.3210 zone.
Again, looking to the left you can see this is an important flip zone.
Take profit will be the 1.3120 zone but let us see how price will act around the 1.3160 zone.
Will be interesting to see how Oil reacts since both Oil and Cad are highly correlated. On the 4 hour charts for both USOIL and UKOIL, we have 4 hour breakout albeit already late in the trend.
면책사항
이 정보와 게시물은 TradingView에서 제공하거나 보증하는 금융, 투자, 거래 또는 기타 유형의 조언이나 권고 사항을 의미하거나 구성하지 않습니다. 자세한 내용은 이용 약관을 참고하세요.
면책사항
이 정보와 게시물은 TradingView에서 제공하거나 보증하는 금융, 투자, 거래 또는 기타 유형의 조언이나 권고 사항을 의미하거나 구성하지 않습니다. 자세한 내용은 이용 약관을 참고하세요.