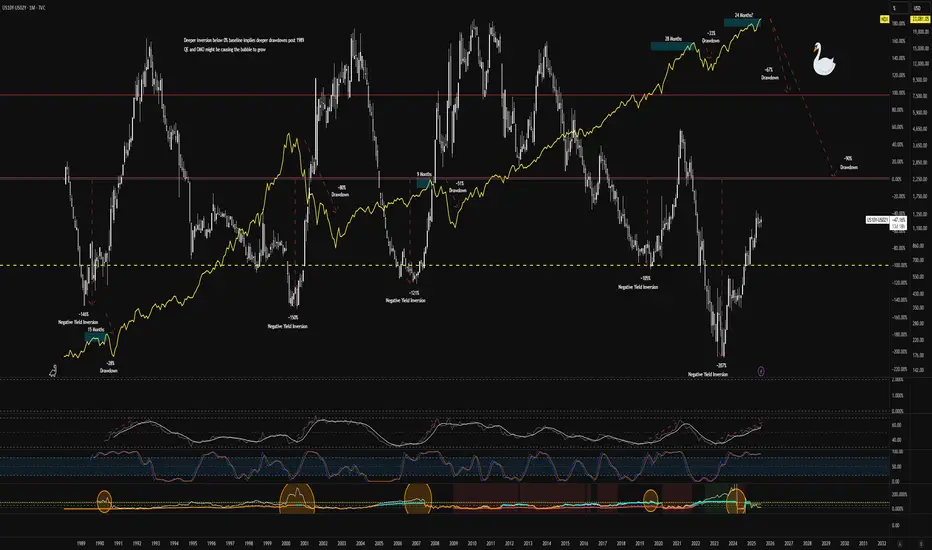
It appears that since 1989, deeper inversions of the yield curve have led to deeper drawdowns in the $NDX. Relative strength always appears to be in a steeper move upward coupled with fuzzy signals in volatility before the drawdown. Based on the previous market crashes, anything from a 60% to 90% drawdown appears to be plausible.
Currently buying long-expiry OTM put verticals across tech meme names (think PLTR) and potentially on some stalwart Mag7 tickers (maybe
  META) for pennies for potentially massive risk/reward paydays. Nothing more than a few grand, but I'm also long exposure to battery materials, hydrogen, and other energy plays.
  ABAT
ABAT  PLUG
PLUG  WWR
WWR  LAC
LAC  ENVX
ENVX  CHPT
CHPT  LEU
LEU  SMR
SMR
Best of luck.
Currently buying long-expiry OTM put verticals across tech meme names (think
Best of luck.
면책사항
이 정보와 게시물은 TradingView에서 제공하거나 보증하는 금융, 투자, 거래 또는 기타 유형의 조언이나 권고 사항을 의미하거나 구성하지 않습니다. 자세한 내용은 이용 약관을 참고하세요.
면책사항
이 정보와 게시물은 TradingView에서 제공하거나 보증하는 금융, 투자, 거래 또는 기타 유형의 조언이나 권고 사항을 의미하거나 구성하지 않습니다. 자세한 내용은 이용 약관을 참고하세요.