숏
US 100 (A BEARISH PATTERN)
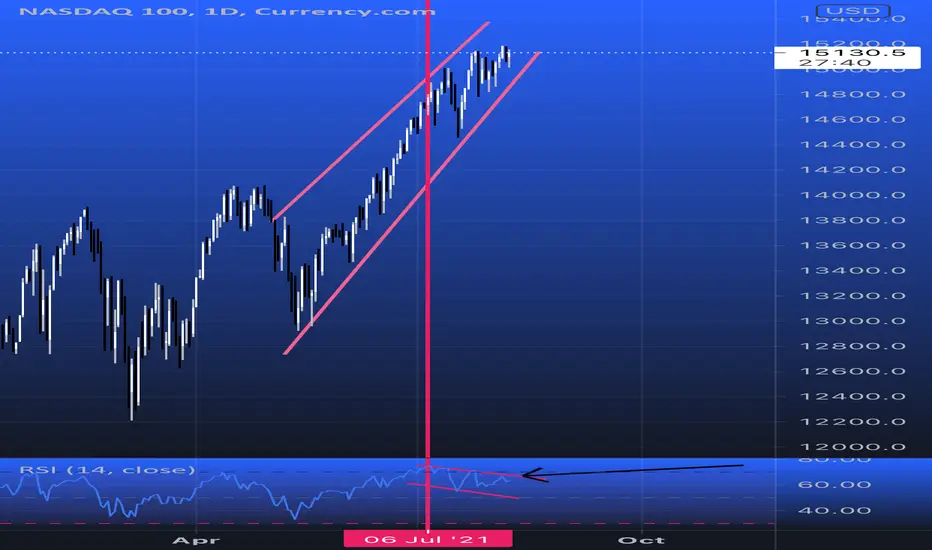
Here we can see clearly the US Index seems to have formed a double top (M), a bearish pattern, on the daily time frame. The RSI indicator is also showing us a Divergence down trend from the actual chart + it’s also near the overbought territory.
Keep an eye on the US INDEX over coming days or week. Happy pip hunting traders.
Keep an eye on the US INDEX over coming days or week. Happy pip hunting traders.
관련 발행물
면책사항
이 정보와 게시물은 TradingView에서 제공하거나 보증하는 금융, 투자, 거래 또는 기타 유형의 조언이나 권고 사항을 의미하거나 구성하지 않습니다. 자세한 내용은 이용 약관을 참고하세요.
면책사항
이 정보와 게시물은 TradingView에서 제공하거나 보증하는 금융, 투자, 거래 또는 기타 유형의 조언이나 권고 사항을 의미하거나 구성하지 않습니다. 자세한 내용은 이용 약관을 참고하세요.