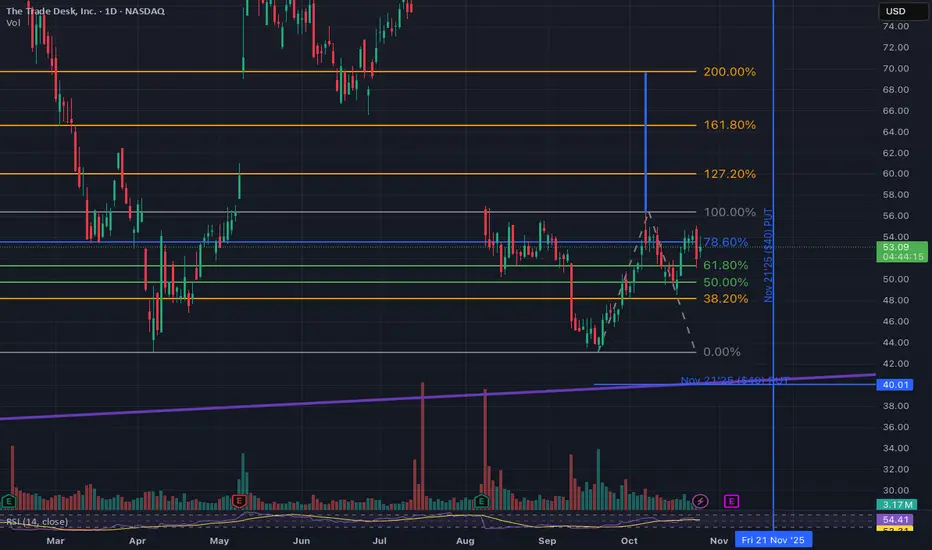
TTD has been forming a clear inverse head and shoulders pattern since its ER drop on 8th of August. If the pattern plays out TTD can reach around $70 where the 200% fib extension is.
If we zoom out we can see that it has a huge double bottom patter as well. ER on 6th of November may send it directly to $70.
It is possible to hedge the position with a 40$ strike PUT.
If we zoom out we can see that it has a huge double bottom patter as well. ER on 6th of November may send it directly to $70.
It is possible to hedge the position with a 40$ strike PUT.
면책사항
해당 정보와 게시물은 금융, 투자, 트레이딩 또는 기타 유형의 조언이나 권장 사항으로 간주되지 않으며, 트레이딩뷰에서 제공하거나 보증하는 것이 아닙니다. 자세한 내용은 이용 약관을 참조하세요.
면책사항
해당 정보와 게시물은 금융, 투자, 트레이딩 또는 기타 유형의 조언이나 권장 사항으로 간주되지 않으며, 트레이딩뷰에서 제공하거나 보증하는 것이 아닙니다. 자세한 내용은 이용 약관을 참조하세요.