📈 Ticker: TSM (Taiwan Semiconductor Manufacturing Co.)
Recommendation: LONG
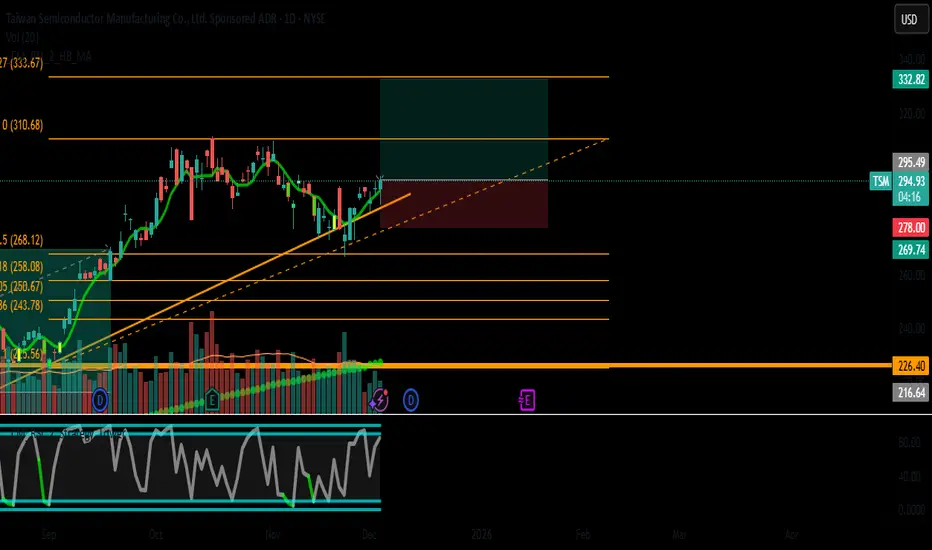
Instrument: NYSE:TSM
Timeframe: Daily + Weekly
Strategy: Position Trade with Swing Entry
Sector: Semiconductors/Foundry
🎯 Trade Parameters
Entry Price: $294.85
Stop Loss: $278.00 (-5.7%)
Take Profit: $332.82 (+12.9%)
Risk/Reward: 1:2.25
Position Size: Medium-Large
Holding Period: 4-8 weeks
Expected Move: +$37.97 per share
📊 Technical Analysis
Multi-Timeframe Convergence:
Weekly Chart (Long-Term Bullish):
Primary uptrend intact since 2020
Testing 50-week MA support (~$285)
Higher highs & higher lows structure
Volume shows institutional accumulation
Daily Chart (Entry Setup - Bullish Reversal):
Previous: Bajista (downtrend)
Current: Forming reversal pattern
RSI(14): 55.57 (bullish momentum returning)
MACD: Histogram turning positive (+0.14)
Price reclaiming SMA_20 ($286.64)
Bullish divergence forming
4-Hour Chart (Momentum Building):
Higher lows establishing
RSI(14): 58.67 (bullish bias)
MACD above signal line (+1.42)
Breaking above short-term resistance
1-Hour Chart (Immediate Trigger):
Alcista trend confirmed
RSI(14): 60.36 (healthy momentum)
MACD strongly positive (+1.88)
Volume confirming move
🏆 Key Levels & Pattern
Support Zones:
$290-292 (immediate support, SMA_20 4H)
$285-287 (50-week MA + psychological)
$278.00 (Stop Loss - pattern invalidation)
$270 (200-day MA - major support)
Resistance Zones:
$300 (round number + recent highs)
$310-315 (previous consolidation)
$332.82 (Primary TP - measured move)
$340-350 (extension target)
Pattern Recognition:
Bullish reversal from $286 support
Inverse head & shoulders forming (potential)
Measured move: $286 → $294 = $8 → Target: $294 + $38 = $332
💼 Fundamental Backdrop - EXCELLENT
Growth Metrics (Exceptional):
Revenue Growth: +33.9% YoY (Strong growth)
Net Income Growth: +36.0% YoY (Strong growth)
Market Position: #1 Semiconductor Foundry globally
Technological Leadership: 3nm/2nm process lead
Financial Health:
Debt-to-Asset Ratio: 12.5% (Low)
Interest Coverage: 174x (Exceptional)
Debt Score: 10/10 (Perfect)
Fundamental Score: 7/10 (High)
Valuation:
P/E: 30.5x (Premium for growth)
P/B: 1.52x (Fairly valued)
P/S: 0.42x (Undervalued relative to sales)
PEG Ratio: <1 (Growth at reasonable price)
🎮 Trade Management
Entry Strategies:
Aggressive: Market order at current levels ($294-295)
Conservative: Limit order at $293.50-294.50
Scaled Entry:
50% at $294.85
25% at $292.00
25% at $290.00
Exit Strategy:
TP1: $315.00 (take 30-40% profit)
TP2: $332.82 (remaining position)
Trailing Stop: Activate at $320 (move to $310)
Time Stop: 8 weeks if TP not reached
Risk Management:
Max portfolio allocation: 5-8%
Stop loss: MUST be respected
Monitor semiconductor sector (SOXX)
Hedge with puts if portfolio >10% semis
⚡ Catalysts & Triggers
Immediate Catalysts:
Break above $295 with volume >5M
Semiconductor sector rotation
AI/Cloud demand surge
Upcoming Events:
Q4 earnings: January 2026 (est.)
Technology symposiums
New fab announcements
Customer design wins (Apple, NVIDIA, AMD)
Sector Tailwinds:
AI hardware acceleration
5G/6G infrastructure
Automotive chip demand
Geopolitical reshoring benefits
📉 Risk Assessment
Primary Risks:
Semiconductor cycle downturn
Geopolitical tensions (Taiwan)
Valuation compression in tech
Break below $278 support
Risk Mitigation:
Strict stop loss at $278.00
Monitor SOXX ETF for sector health
Diversify within portfolio
Consider options strategies for protection
Volatility Note:
ATR: $9.21 (high volatility)
Adjust position size accordingly
Wider stops may be needed for swing traders
🔍 Confirmation Signals Needed
Bullish Confirmation:
Daily close above $295
RSI(14) > 60 on daily
Volume > 4M on up days
SOXX above $520
MACD crossover above zero line
Warning Signs:
Daily close below $290
RSI(14) < 50 on daily
Volume drying up on rallies
Semiconductor sector weakness
Break below $285 (50-week MA)
📱 Monitoring Plan
Daily:
Price action relative to $290 support
RSI momentum (maintain >50)
Volume patterns (institutional flow)
SOXX correlation
Weekly:
50-week MA support test
Overall trend structure
Fundamental developments
Sector news flow
Key Indicators to Watch:
SOXX ETF performance
Taiwan Weighted Index
USD/TWD exchange rate
Global PMI data (manufacturing)
🏁 Trade Thesis Summary
Bull Case (70% Probability):
Technical reversal confirmed
Fundamental growth exceptional
Sector tailwinds strong
Valuation reasonable for market leader
Measured move to $332 achievable
Base Case (25% Probability):
Range-bound between $285-315
Gradual appreciation to $310
Longer timeframe required
Bear Case (5% Probability):
Break below $278 invalidation
Semiconductor downturn
Geopolitical escalation
Expected Outcomes:
Best Case: $332.82 (+12.9%) in 4-6 weeks
Base Case: $315.00 (+6.8%) in 6-8 weeks
Worst Case: $278.00 (-5.7%) stop loss
🎨 Chart Setup Instructions:
Draw Key Levels:
Horizontal line at $278 (Stop Loss - RED)
Horizontal line at $295 (Breakout - YELLOW)
Horizontal line at $315 (TP1 - GREEN)
Horizontal line at $332.82 (TP2 - GREEN)
Add Indicators:
RSI(14) - watch for >60 breakout
MACD(12,26,9) - crossover confirmation
Volume profile (OBV helpful)
Bollinger Bands (20,2)
Pattern Recognition:
Highlight potential inverse H&S
Draw trendline from $286 low
Mark measured move projection
Watch Correlations:
Add SOXX ETF to comparison
Monitor TAIEX (Taiwan index)
💎 Why This Trade Works:
Fundamental Moat: #1 foundry globally
Growth Story: +34% revenue growth
Technical Setup: Reversal from support
Risk Management: Clear levels (1:2.25 R:R)
Sector Momentum: Semiconductors in favor
Valuation: P/S 0.42x attractive for growth
#TradingView #TSM #TaiwanSemiconductor #Semiconductors #PositionTrading #BullishReversal #GrowthStocks #TechnicalAnalysis #RiskManagement #Foundry #Investing
Disclaimer: This is educational content, not financial advice. Trade at your own risk. Past performance doesn't guarantee future results. Always conduct your own analysis and consider your risk tolerance. Semiconductor stocks can be volatile.
Liked this idea? 👍 Follow for more institutional-grade setups!
Questions or adjustments? Drop them in comments below! ⬇️
Trade safe and manage your risk! 🚀
Recommendation: LONG
Instrument: NYSE:TSM
Timeframe: Daily + Weekly
Strategy: Position Trade with Swing Entry
Sector: Semiconductors/Foundry
🎯 Trade Parameters
Entry Price: $294.85
Stop Loss: $278.00 (-5.7%)
Take Profit: $332.82 (+12.9%)
Risk/Reward: 1:2.25
Position Size: Medium-Large
Holding Period: 4-8 weeks
Expected Move: +$37.97 per share
📊 Technical Analysis
Multi-Timeframe Convergence:
Weekly Chart (Long-Term Bullish):
Primary uptrend intact since 2020
Testing 50-week MA support (~$285)
Higher highs & higher lows structure
Volume shows institutional accumulation
Daily Chart (Entry Setup - Bullish Reversal):
Previous: Bajista (downtrend)
Current: Forming reversal pattern
RSI(14): 55.57 (bullish momentum returning)
MACD: Histogram turning positive (+0.14)
Price reclaiming SMA_20 ($286.64)
Bullish divergence forming
4-Hour Chart (Momentum Building):
Higher lows establishing
RSI(14): 58.67 (bullish bias)
MACD above signal line (+1.42)
Breaking above short-term resistance
1-Hour Chart (Immediate Trigger):
Alcista trend confirmed
RSI(14): 60.36 (healthy momentum)
MACD strongly positive (+1.88)
Volume confirming move
🏆 Key Levels & Pattern
Support Zones:
$290-292 (immediate support, SMA_20 4H)
$285-287 (50-week MA + psychological)
$278.00 (Stop Loss - pattern invalidation)
$270 (200-day MA - major support)
Resistance Zones:
$300 (round number + recent highs)
$310-315 (previous consolidation)
$332.82 (Primary TP - measured move)
$340-350 (extension target)
Pattern Recognition:
Bullish reversal from $286 support
Inverse head & shoulders forming (potential)
Measured move: $286 → $294 = $8 → Target: $294 + $38 = $332
💼 Fundamental Backdrop - EXCELLENT
Growth Metrics (Exceptional):
Revenue Growth: +33.9% YoY (Strong growth)
Net Income Growth: +36.0% YoY (Strong growth)
Market Position: #1 Semiconductor Foundry globally
Technological Leadership: 3nm/2nm process lead
Financial Health:
Debt-to-Asset Ratio: 12.5% (Low)
Interest Coverage: 174x (Exceptional)
Debt Score: 10/10 (Perfect)
Fundamental Score: 7/10 (High)
Valuation:
P/E: 30.5x (Premium for growth)
P/B: 1.52x (Fairly valued)
P/S: 0.42x (Undervalued relative to sales)
PEG Ratio: <1 (Growth at reasonable price)
🎮 Trade Management
Entry Strategies:
Aggressive: Market order at current levels ($294-295)
Conservative: Limit order at $293.50-294.50
Scaled Entry:
50% at $294.85
25% at $292.00
25% at $290.00
Exit Strategy:
TP1: $315.00 (take 30-40% profit)
TP2: $332.82 (remaining position)
Trailing Stop: Activate at $320 (move to $310)
Time Stop: 8 weeks if TP not reached
Risk Management:
Max portfolio allocation: 5-8%
Stop loss: MUST be respected
Monitor semiconductor sector (SOXX)
Hedge with puts if portfolio >10% semis
⚡ Catalysts & Triggers
Immediate Catalysts:
Break above $295 with volume >5M
Semiconductor sector rotation
AI/Cloud demand surge
Upcoming Events:
Q4 earnings: January 2026 (est.)
Technology symposiums
New fab announcements
Customer design wins (Apple, NVIDIA, AMD)
Sector Tailwinds:
AI hardware acceleration
5G/6G infrastructure
Automotive chip demand
Geopolitical reshoring benefits
📉 Risk Assessment
Primary Risks:
Semiconductor cycle downturn
Geopolitical tensions (Taiwan)
Valuation compression in tech
Break below $278 support
Risk Mitigation:
Strict stop loss at $278.00
Monitor SOXX ETF for sector health
Diversify within portfolio
Consider options strategies for protection
Volatility Note:
ATR: $9.21 (high volatility)
Adjust position size accordingly
Wider stops may be needed for swing traders
🔍 Confirmation Signals Needed
Bullish Confirmation:
Daily close above $295
RSI(14) > 60 on daily
Volume > 4M on up days
SOXX above $520
MACD crossover above zero line
Warning Signs:
Daily close below $290
RSI(14) < 50 on daily
Volume drying up on rallies
Semiconductor sector weakness
Break below $285 (50-week MA)
📱 Monitoring Plan
Daily:
Price action relative to $290 support
RSI momentum (maintain >50)
Volume patterns (institutional flow)
SOXX correlation
Weekly:
50-week MA support test
Overall trend structure
Fundamental developments
Sector news flow
Key Indicators to Watch:
SOXX ETF performance
Taiwan Weighted Index
USD/TWD exchange rate
Global PMI data (manufacturing)
🏁 Trade Thesis Summary
Bull Case (70% Probability):
Technical reversal confirmed
Fundamental growth exceptional
Sector tailwinds strong
Valuation reasonable for market leader
Measured move to $332 achievable
Base Case (25% Probability):
Range-bound between $285-315
Gradual appreciation to $310
Longer timeframe required
Bear Case (5% Probability):
Break below $278 invalidation
Semiconductor downturn
Geopolitical escalation
Expected Outcomes:
Best Case: $332.82 (+12.9%) in 4-6 weeks
Base Case: $315.00 (+6.8%) in 6-8 weeks
Worst Case: $278.00 (-5.7%) stop loss
🎨 Chart Setup Instructions:
Draw Key Levels:
Horizontal line at $278 (Stop Loss - RED)
Horizontal line at $295 (Breakout - YELLOW)
Horizontal line at $315 (TP1 - GREEN)
Horizontal line at $332.82 (TP2 - GREEN)
Add Indicators:
RSI(14) - watch for >60 breakout
MACD(12,26,9) - crossover confirmation
Volume profile (OBV helpful)
Bollinger Bands (20,2)
Pattern Recognition:
Highlight potential inverse H&S
Draw trendline from $286 low
Mark measured move projection
Watch Correlations:
Add SOXX ETF to comparison
Monitor TAIEX (Taiwan index)
💎 Why This Trade Works:
Fundamental Moat: #1 foundry globally
Growth Story: +34% revenue growth
Technical Setup: Reversal from support
Risk Management: Clear levels (1:2.25 R:R)
Sector Momentum: Semiconductors in favor
Valuation: P/S 0.42x attractive for growth
#TradingView #TSM #TaiwanSemiconductor #Semiconductors #PositionTrading #BullishReversal #GrowthStocks #TechnicalAnalysis #RiskManagement #Foundry #Investing
Disclaimer: This is educational content, not financial advice. Trade at your own risk. Past performance doesn't guarantee future results. Always conduct your own analysis and consider your risk tolerance. Semiconductor stocks can be volatile.
Liked this idea? 👍 Follow for more institutional-grade setups!
Questions or adjustments? Drop them in comments below! ⬇️
Trade safe and manage your risk! 🚀
면책사항
해당 정보와 게시물은 금융, 투자, 트레이딩 또는 기타 유형의 조언이나 권장 사항으로 간주되지 않으며, 트레이딩뷰에서 제공하거나 보증하는 것이 아닙니다. 자세한 내용은 이용 약관을 참조하세요.
면책사항
해당 정보와 게시물은 금융, 투자, 트레이딩 또는 기타 유형의 조언이나 권장 사항으로 간주되지 않으며, 트레이딩뷰에서 제공하거나 보증하는 것이 아닙니다. 자세한 내용은 이용 약관을 참조하세요.