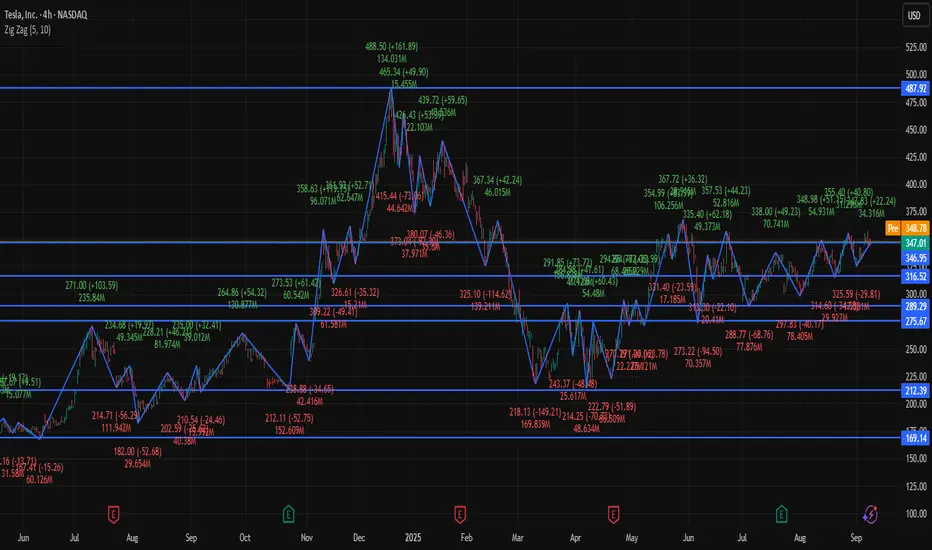
📊 Tesla (TSLA) Snapshot
Current Price: ~$346.97
Recent Range: ~$325 – $358
Intraday Change: Small gain (~+0.2%)
🔎 Key Levels (4H Focus)
Resistance: ~$347 – $351 (immediate ceiling)
Support: ~$325 – $330 (key downside buffer)
📉 Technical Indicators
RSI (14): ~57 → neutral with slight bullish bias
MACD: Positive → upward momentum
Moving Averages: Price trading above 20, 50, 200-period moving averages → bullish trend
Stochastics: Neutral → no overbought/oversold condition
📌 4-Hour Outlook
Bullish Scenario: Break above $347–348 could push price toward $358+.
Bearish Scenario: Drop below $330–332 could test support around $325.
Overall Bias: Moderately bullish; momentum positive but needs to clear resistance for acceleration.
✅ Conclusion: On the 4-hour chart, TSLA is in a moderate bullish phase, trading above key moving averages. The key battle zone is $347–351 for resistance, and $325–330 provides support in case of a pullback.
면책사항
해당 정보와 게시물은 금융, 투자, 트레이딩 또는 기타 유형의 조언이나 권장 사항으로 간주되지 않으며, 트레이딩뷰에서 제공하거나 보증하는 것이 아닙니다. 자세한 내용은 이용 약관을 참조하세요.
면책사항
해당 정보와 게시물은 금융, 투자, 트레이딩 또는 기타 유형의 조언이나 권장 사항으로 간주되지 않으며, 트레이딩뷰에서 제공하거나 보증하는 것이 아닙니다. 자세한 내용은 이용 약관을 참조하세요.