As of the latest available data, here are the key support and resistance levels for Tata Motors Ltd. (TATAMOTORS) for the upcoming week:
📊 Weekly Support and Resistance Levels
Type Level Value (₹)
Support S1 773.38
S2 756.47
S3 737.93
Resistance R1 808.83
R2 827.37
R3 844.28
These levels are derived from technical analysis and serve as potential entry, exit, or stop-loss points for traders. A breach below the support levels could indicate a bearish trend, while a breakout above the resistance levels may signal a bullish move.
🔍 Technical Indicators Overview
RSI (14): 43.38 — Indicates neutral momentum.
MACD (12,26): 0 — Suggests a neutral trend.
Moving Averages:
20-day SMA: 655.61 — Slightly below current price, indicating a potential short-term downtrend.
50-day SMA: 655.34 — Aligns with the 20-day SMA, reinforcing the neutral to bearish outlook.
200-day SMA: 655.93 — Further confirms the downtrend.
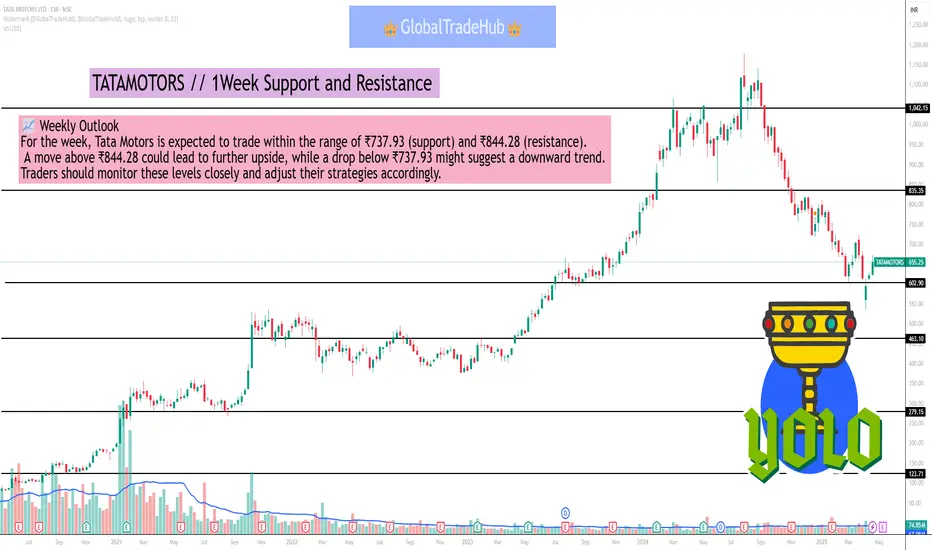
📈 Weekly Outlook
For the week, Tata Motors is expected to trade within the range of ₹737.93 (support) and ₹844.28 (resistance). A move above ₹844.28 could lead to further upside, while a drop below ₹737.93 might suggest a downward trend. Traders should monitor these levels closely and adjust their strategies accordingly.
📊 Weekly Support and Resistance Levels
Type Level Value (₹)
Support S1 773.38
S2 756.47
S3 737.93
Resistance R1 808.83
R2 827.37
R3 844.28
These levels are derived from technical analysis and serve as potential entry, exit, or stop-loss points for traders. A breach below the support levels could indicate a bearish trend, while a breakout above the resistance levels may signal a bullish move.
🔍 Technical Indicators Overview
RSI (14): 43.38 — Indicates neutral momentum.
MACD (12,26): 0 — Suggests a neutral trend.
Moving Averages:
20-day SMA: 655.61 — Slightly below current price, indicating a potential short-term downtrend.
50-day SMA: 655.34 — Aligns with the 20-day SMA, reinforcing the neutral to bearish outlook.
200-day SMA: 655.93 — Further confirms the downtrend.
📈 Weekly Outlook
For the week, Tata Motors is expected to trade within the range of ₹737.93 (support) and ₹844.28 (resistance). A move above ₹844.28 could lead to further upside, while a drop below ₹737.93 might suggest a downward trend. Traders should monitor these levels closely and adjust their strategies accordingly.
관련 발행물
면책사항
이 정보와 게시물은 TradingView에서 제공하거나 보증하는 금융, 투자, 거래 또는 기타 유형의 조언이나 권고 사항을 의미하거나 구성하지 않습니다. 자세한 내용은 이용 약관을 참고하세요.
관련 발행물
면책사항
이 정보와 게시물은 TradingView에서 제공하거나 보증하는 금융, 투자, 거래 또는 기타 유형의 조언이나 권고 사항을 의미하거나 구성하지 않습니다. 자세한 내용은 이용 약관을 참고하세요.