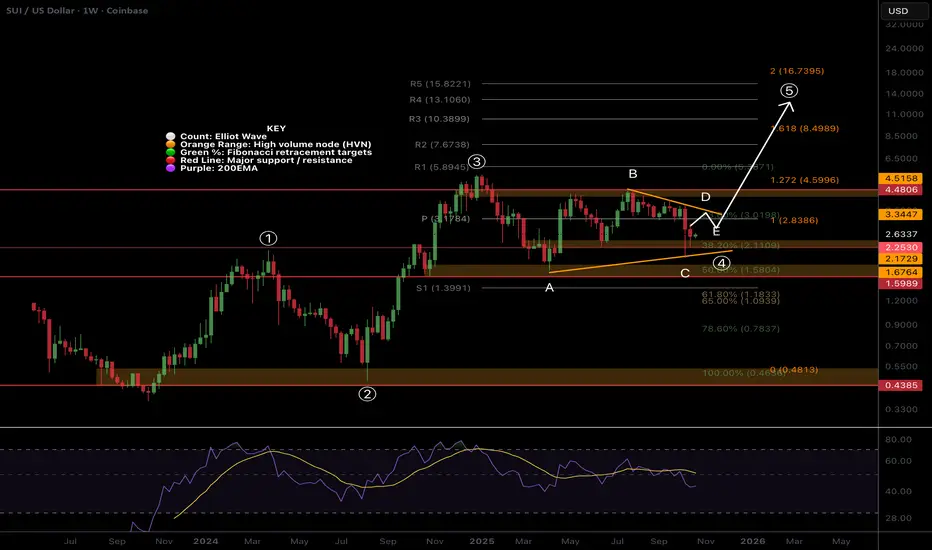
Wave (5) has a minimum target of the R5 weekly pivot at $15.8, at the 2 Fibonacci extension.
Falling below $1.7, wave A, invalidates the analysis and suggests we have much lower to go in a bear market.
Weekly RSI is bearish with lower to go but hidden bullish divergence has formed, a good raly will confirm.
SUI i holding up better than most with shallower retracements overall.
Safe trading
PhD Cand: Investing, Sentiment & Social Mood, MSc Financial Econ
Technical Analyst 8 years, Trader/Investor 15 years
Market Breakdown & Alpha Reports: detrended.substack.com
Earn & Learn Trade Planning & Signals (FREE WEEK): tradesignals.substack.com
Technical Analyst 8 years, Trader/Investor 15 years
Market Breakdown & Alpha Reports: detrended.substack.com
Earn & Learn Trade Planning & Signals (FREE WEEK): tradesignals.substack.com
관련 발행물
면책사항
이 정보와 게시물은 TradingView에서 제공하거나 보증하는 금융, 투자, 거래 또는 기타 유형의 조언이나 권고 사항을 의미하거나 구성하지 않습니다. 자세한 내용은 이용 약관을 참고하세요.