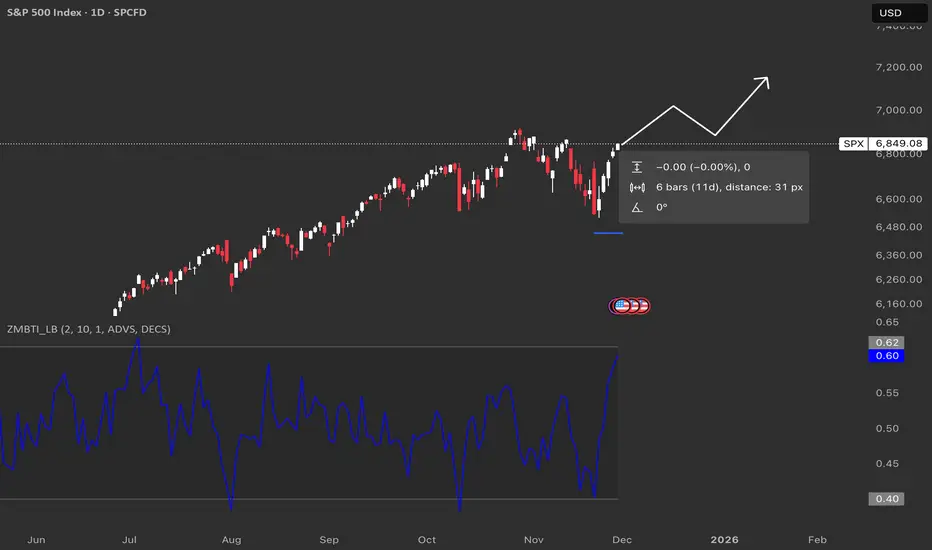
The Breadth Thrust Indicator is a technical indicator that looks at how many stocks advance vs. decline over 10 days.
When it snaps from around 0.40 to above about 0.615 in 10 trading days or less, that’s called a Zweig Breadth Thrust and has historically lined up with strong bull runs more often than not.
Historically it doesn’t happen often, but when it does, forward returns over the next several months have usually been positive, which is why traders get excited when the line on your chart surges like this.
Historically, once a full thrust has triggered, the index has often been higher 6–12 months later in the majority of cases.
면책사항
해당 정보와 게시물은 금융, 투자, 트레이딩 또는 기타 유형의 조언이나 권장 사항으로 간주되지 않으며, 트레이딩뷰에서 제공하거나 보증하는 것이 아닙니다. 자세한 내용은 이용 약관을 참조하세요.
면책사항
해당 정보와 게시물은 금융, 투자, 트레이딩 또는 기타 유형의 조언이나 권장 사항으로 간주되지 않으며, 트레이딩뷰에서 제공하거나 보증하는 것이 아닙니다. 자세한 내용은 이용 약관을 참조하세요.