Shiba Inu (SHIB) technical analysis:
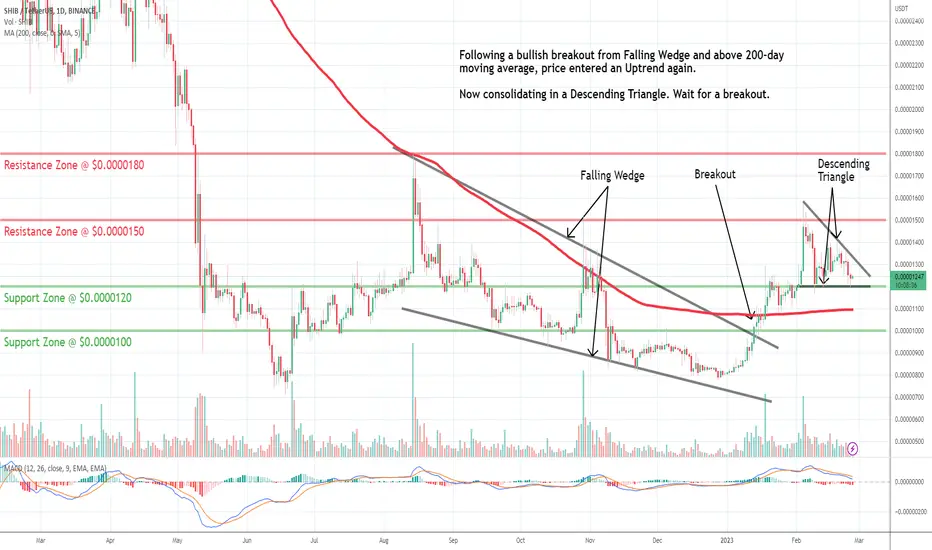
Trade setup: Following a bullish breakout from Falling Wedge and above 200-day moving average, price entered an Uptrend again. Now it’s consolidating in a from Descending triangle Pattern. Wait for a breakout.
Trend: Neutral on Short-Term basis and Uptrend on Medium- and Long-Term basis.
Momentum is Mixed as MACD Line is below MACD Signal Line (Bearish) but RSI ~ 50 (Neutral).
Support and Resistance: Nearest Support Zone is $0.000012 (previous resistance), then $0.000010. The nearest Resistance Zone is $0.000015, then $0.0000180.
면책사항
이 정보와 게시물은 TradingView에서 제공하거나 보증하는 금융, 투자, 거래 또는 기타 유형의 조언이나 권고 사항을 의미하거나 구성하지 않습니다. 자세한 내용은 이용 약관을 참고하세요.
면책사항
이 정보와 게시물은 TradingView에서 제공하거나 보증하는 금융, 투자, 거래 또는 기타 유형의 조언이나 권고 사항을 의미하거나 구성하지 않습니다. 자세한 내용은 이용 약관을 참고하세요.