As of May 29, 2025, Schneider Electric Infrastructure Ltd. (NSE: SCHNEIDER) is trading at ₹778.70, reflecting an 11.57% increase over the past 24 hours .
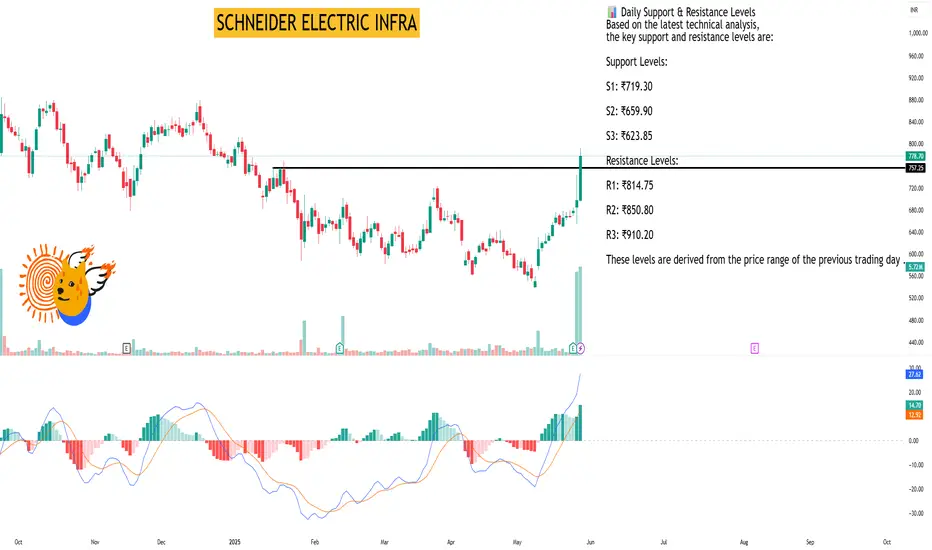
📊 Daily Support & Resistance Levels
Based on the latest technical analysis, the key support and resistance levels are:
Support Levels:
S1: ₹719.30
S2: ₹659.90
S3: ₹623.85
Resistance Levels:
R1: ₹814.75
R2: ₹850.80
R3: ₹910.20
These levels are derived from the price range of the previous trading day .
🔍 Technical Indicators Overview
Relative Strength Index (RSI): 79.38 – Indicates overbought conditions.
MACD (12,26): 27.62 – Suggests bullish momentum.
ADX: 28.53 – Points to a strong trend.
Stochastic Oscillator: 90.63 – Suggests overbought territory.
Rate of Change (ROC): 25.57 – Indicates strong upward momentum.
Supertrend: 634.53 – Below current price, indicating bullish trend.
Parabolic SAR (PSAR): 646.47 – Below current price, supporting bullish sentiment.
These indicators collectively suggest a strong bullish trend for Schneider Electric Infrastructure Ltd. .
📈 Market Sentiment
The technical indicators collectively suggest a strong bullish sentiment for Schneider Electric Infrastructure Ltd. However, the RSI and Stochastic Oscillator indicate that the stock is in overbought territory, which may lead to a short-term correction. Investors should monitor the support and resistance levels closely for potential breakout or pullback scenarios.
Please note that stock market investments are subject to market risks, and it's essential to conduct thorough research or consult with a financial advisor before making investment decisions.
I built a Buy & Sell Signal Indicator with 85% accuracy.
📈 Get access via DM or
WhatsApp: wa.link/d997q0
| Email: techncialexpress@gmail.com
| Script Coder | Trader | Investor | From India
📈 Get access via DM or
WhatsApp: wa.link/d997q0
| Email: techncialexpress@gmail.com
| Script Coder | Trader | Investor | From India
관련 발행물
면책사항
이 정보와 게시물은 TradingView에서 제공하거나 보증하는 금융, 투자, 거래 또는 기타 유형의 조언이나 권고 사항을 의미하거나 구성하지 않습니다. 자세한 내용은 이용 약관을 참고하세요.