Perhaps the most important single earnings release of this earnings season is on deck. AI-friendly chipmaker Nvidia  NVDA will report earnings this week at a time when many of the artificial-intelligence trade's darlings have come off of their highest valuations. What does NVDA's technical and fundamental analysis say ahead of the report?
Let's take a look:
Nvidia's Fundamental Analysis
What timing! NVDA will unveil fiscal Q2 earnings on Wednesday after the bell in what could be the market's next big thing following AI stocks' recent pullback and Federal Reserve Chairman Jerome Powell's key Jackson Hole speech.
Nvidia also recently got the go ahead from the US government to resume exports of certain products to China, and its stock has risen more than 100% since hitting an $86.62 52-week intraday low on April 7.
As I write this, analysts expect NVDA to report $1.01 of adjusted earnings per share on about $45.3 billion of revenue.
That would be good for about 53% year-over-year growth from fiscal Q2 2025's $30 billion in revenue, as well as a 48.5% increase from the firm's $0.68 in adjusted EPS in the same period last year.
Now, many investors would view 53% year-over-year sales growth as enormous for most companies, but that would actually represent a deceleration of y/y growth for Nvidia.
That said, the "law of large numbers" argues that the pace at which Nvidia has been increasing year-over-year sales since the surge in AI-based capital-expenditure spending began in earnest is unsustainable.
Still, some on Wall Street expect NVDA to stabilize sales growth in the low 50%-ish range for at least a few quarters.
A number of very highly rated sell-side analysts have also increased their price targets for Nvidia heading into this week's earnings report.
Cantor Fitzgerald's CJ Muse, Joseph Moore of Morgan Stanley, TD Cowen's Joshua Buchalter and John Vinh of KeyBanc have all upped their NVDA target prices in just the past few days. TipRanks rates every one of those four at either four or five stars out of a possible five.
The group increased their price targets from an average of $191.25 to an average of $224 vs. the $179.81 that Nvidia closed at on Monday.
Nvidia's Technical Analysis
Now let's look at NVDA's year-to-date chart as of Aug. 20:

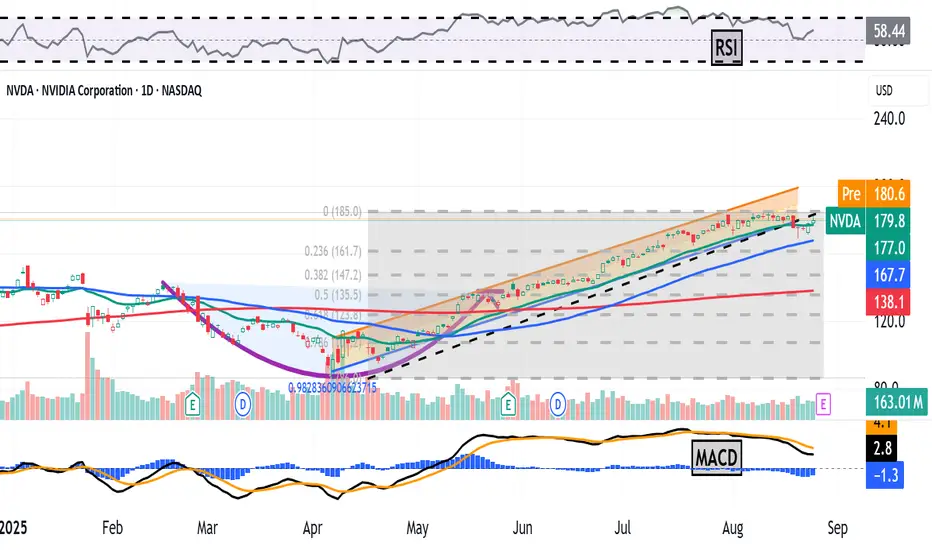
We have a very complex chart to take in here.
Readers will first note that a "cup-with-handle" pattern (the purple curving line at the chart's center) kicked off Nvidia's April-into-August rally.
However, the stock's trend -- illustrated here by a Raff Regression model marked with orange shading -- has been broken to the downside as Nvidia approaches earnings.
NVDA also appears to have tested the swing crowd at the stock's 21-day Exponential Moving Average (or "EMA," marked with a green line) and lost that fight.
Next up would be the stock's 50-day Simple Moving Average, or "SMA," denoted by the blue line above. It will be very interesting to see if institutional money defends the stock at that level.
Keep in mind that key Fibonacci retracement levels also exist at roughly $162 (23.6% retracement) and $147 (38.2% retracement), as denoted by the gray shaded area above.
The stock's 50-day SMA is the downside pivot that could pave the way to the stock's even more important 200-day SMA (the red line above at $137.40).
Meanwhile, Nvidia's upside pivot would be the stock's recent high near $184. A retake of that level in response to a well-received earnings report could make the above analysts' new target prices suddenly seem very realistic.
As for the other technical indicators in the above chart, they're not looking very pretty.
Nvidia's Relative Strength Index (the gray line at the chart's top) is sinking like a rock and is trying to hold at a neutral reading.
And check out the stock's daily Moving Average Convergence Divergence indicator (or "MACD," marked with black and gold lines and blue bars at the chart's bottom).
The histogram of the 9-day EMA (marked with blue bars) is suddenly deeply negative. That's usually a short-term bearish signal.
The 12-day EMA (the black line) has also crossed below the 26-day EMA (the gold line). That's also typically a negative signal -- but with both lines still in positive territory, it's not quite as foreboding.
(Moomoo Technologies Inc. Markets Commentator Stephen “Sarge” Guilfoyle was long NVDA at the time of writing this column.)
This article discusses technical analysis, other approaches, including fundamental analysis, may offer very different views. The examples provided are for illustrative purposes only and are not intended to be reflective of the results you can expect to achieve. Specific security charts used are for illustrative purposes only and are not a recommendation, offer to sell, or a solicitation of an offer to buy any security. Past investment performance does not indicate or guarantee future success. Returns will vary, and all investments carry risks, including loss of principal. This content is also not a research report and is not intended to serve as the basis for any investment decision. The information contained in this article does not purport to be a complete description of the securities, markets, or developments referred to in this material.
Moomoo and its affiliates make no representation or warranty as to the article's adequacy, completeness, accuracy or timeliness for any particular purpose of the above content. Furthermore, there is no guarantee that any statements, estimates, price targets, opinions or forecasts provided herein will prove to be correct.
The Analyst Ratings feature comes from TipRanks, an independent third party. The accuracy, completeness, or reliability cannot be guaranteed and should not be relied upon as a primary basis for any investment decision. The target prices are intended for informational purposes only, not recommendations, and are also not guarantees of future results.
Moomoo is a financial information and trading app offered by Moomoo Technologies Inc. In the U.S., investment products and services on Moomoo are offered by Moomoo Financial Inc., Member FINRA/SIPC.
TradingView is an independent third party not affiliated with Moomoo Financial Inc., Moomoo Technologies Inc., or its affiliates. Moomoo Financial Inc. and its affiliates do not endorse, represent or warrant the completeness and accuracy of the data and information available on the TradingView platform and are not responsible for any services provided by the third-party platform.
Let's take a look:
Nvidia's Fundamental Analysis
What timing! NVDA will unveil fiscal Q2 earnings on Wednesday after the bell in what could be the market's next big thing following AI stocks' recent pullback and Federal Reserve Chairman Jerome Powell's key Jackson Hole speech.
Nvidia also recently got the go ahead from the US government to resume exports of certain products to China, and its stock has risen more than 100% since hitting an $86.62 52-week intraday low on April 7.
As I write this, analysts expect NVDA to report $1.01 of adjusted earnings per share on about $45.3 billion of revenue.
That would be good for about 53% year-over-year growth from fiscal Q2 2025's $30 billion in revenue, as well as a 48.5% increase from the firm's $0.68 in adjusted EPS in the same period last year.
Now, many investors would view 53% year-over-year sales growth as enormous for most companies, but that would actually represent a deceleration of y/y growth for Nvidia.
That said, the "law of large numbers" argues that the pace at which Nvidia has been increasing year-over-year sales since the surge in AI-based capital-expenditure spending began in earnest is unsustainable.
Still, some on Wall Street expect NVDA to stabilize sales growth in the low 50%-ish range for at least a few quarters.
A number of very highly rated sell-side analysts have also increased their price targets for Nvidia heading into this week's earnings report.
Cantor Fitzgerald's CJ Muse, Joseph Moore of Morgan Stanley, TD Cowen's Joshua Buchalter and John Vinh of KeyBanc have all upped their NVDA target prices in just the past few days. TipRanks rates every one of those four at either four or five stars out of a possible five.
The group increased their price targets from an average of $191.25 to an average of $224 vs. the $179.81 that Nvidia closed at on Monday.
Nvidia's Technical Analysis
Now let's look at NVDA's year-to-date chart as of Aug. 20:
We have a very complex chart to take in here.
Readers will first note that a "cup-with-handle" pattern (the purple curving line at the chart's center) kicked off Nvidia's April-into-August rally.
However, the stock's trend -- illustrated here by a Raff Regression model marked with orange shading -- has been broken to the downside as Nvidia approaches earnings.
NVDA also appears to have tested the swing crowd at the stock's 21-day Exponential Moving Average (or "EMA," marked with a green line) and lost that fight.
Next up would be the stock's 50-day Simple Moving Average, or "SMA," denoted by the blue line above. It will be very interesting to see if institutional money defends the stock at that level.
Keep in mind that key Fibonacci retracement levels also exist at roughly $162 (23.6% retracement) and $147 (38.2% retracement), as denoted by the gray shaded area above.
The stock's 50-day SMA is the downside pivot that could pave the way to the stock's even more important 200-day SMA (the red line above at $137.40).
Meanwhile, Nvidia's upside pivot would be the stock's recent high near $184. A retake of that level in response to a well-received earnings report could make the above analysts' new target prices suddenly seem very realistic.
As for the other technical indicators in the above chart, they're not looking very pretty.
Nvidia's Relative Strength Index (the gray line at the chart's top) is sinking like a rock and is trying to hold at a neutral reading.
And check out the stock's daily Moving Average Convergence Divergence indicator (or "MACD," marked with black and gold lines and blue bars at the chart's bottom).
The histogram of the 9-day EMA (marked with blue bars) is suddenly deeply negative. That's usually a short-term bearish signal.
The 12-day EMA (the black line) has also crossed below the 26-day EMA (the gold line). That's also typically a negative signal -- but with both lines still in positive territory, it's not quite as foreboding.
(Moomoo Technologies Inc. Markets Commentator Stephen “Sarge” Guilfoyle was long NVDA at the time of writing this column.)
This article discusses technical analysis, other approaches, including fundamental analysis, may offer very different views. The examples provided are for illustrative purposes only and are not intended to be reflective of the results you can expect to achieve. Specific security charts used are for illustrative purposes only and are not a recommendation, offer to sell, or a solicitation of an offer to buy any security. Past investment performance does not indicate or guarantee future success. Returns will vary, and all investments carry risks, including loss of principal. This content is also not a research report and is not intended to serve as the basis for any investment decision. The information contained in this article does not purport to be a complete description of the securities, markets, or developments referred to in this material.
Moomoo and its affiliates make no representation or warranty as to the article's adequacy, completeness, accuracy or timeliness for any particular purpose of the above content. Furthermore, there is no guarantee that any statements, estimates, price targets, opinions or forecasts provided herein will prove to be correct.
The Analyst Ratings feature comes from TipRanks, an independent third party. The accuracy, completeness, or reliability cannot be guaranteed and should not be relied upon as a primary basis for any investment decision. The target prices are intended for informational purposes only, not recommendations, and are also not guarantees of future results.
Moomoo is a financial information and trading app offered by Moomoo Technologies Inc. In the U.S., investment products and services on Moomoo are offered by Moomoo Financial Inc., Member FINRA/SIPC.
TradingView is an independent third party not affiliated with Moomoo Financial Inc., Moomoo Technologies Inc., or its affiliates. Moomoo Financial Inc. and its affiliates do not endorse, represent or warrant the completeness and accuracy of the data and information available on the TradingView platform and are not responsible for any services provided by the third-party platform.
면책사항
해당 정보와 게시물은 금융, 투자, 트레이딩 또는 기타 유형의 조언이나 권장 사항으로 간주되지 않으며, 트레이딩뷰에서 제공하거나 보증하는 것이 아닙니다. 자세한 내용은 이용 약관을 참조하세요.
면책사항
해당 정보와 게시물은 금융, 투자, 트레이딩 또는 기타 유형의 조언이나 권장 사항으로 간주되지 않으며, 트레이딩뷰에서 제공하거나 보증하는 것이 아닙니다. 자세한 내용은 이용 약관을 참조하세요.