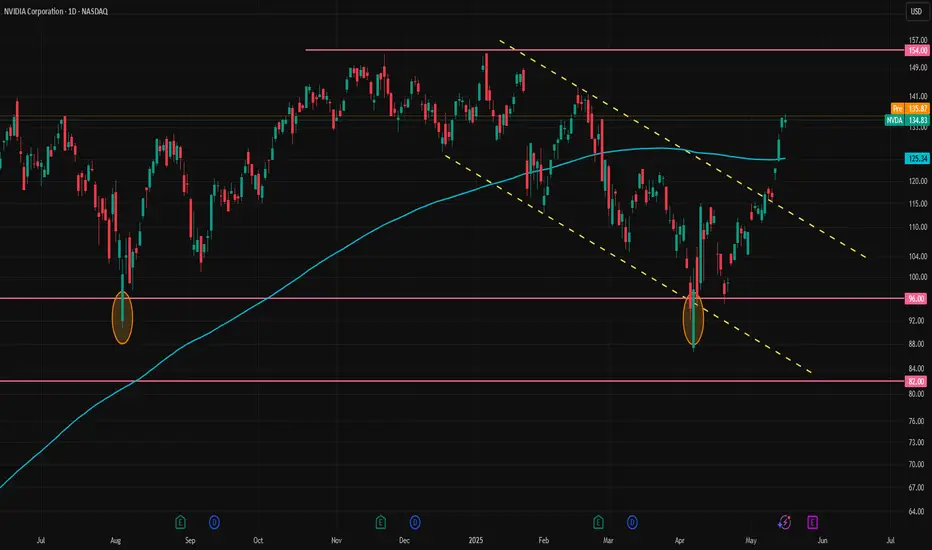
Nvidia has surged more than 55% since the early April dip and over 40% from the second dip, as expected in our earlier post. This massive rally was supported by a softening in trade policy (Bloomberg trade uncertainty index fell to 7.67 from 16.27), Nvidia's valuation being well below historical averages, and momentum sparked by Trump’s Middle East business trip.
Despite the surge, Nvidia still trades below its historical average based on forward price-to-earnings ratios. The stock has averaged a forward P/E of 32.2x over the past year, 34.2x over the last two years, and 40.2x over the past five years. Its current forward P/E stands at 28.4x. If Nvidia were to return to these averages, the implied price would be:
1-year average (32.2x): $153.04
2-year average (34.2x): $162.20
5-year average (40.2x): $190.79
However, relying on the 5-year average may not be ideal, as Nvidia’s explosive growth potential is no longer at the same trajectory it was five years ago. The 1-year average at $153.04 could be a more realistic near-term target.
Around the 1-year p/e price target, Nvidia has also a notable technical resistance. The stock has an infamous double top at $154 that has capped price advances twice before in November and January. This suggests that a short-term bet on further upside could be risky.
If Nvidia pulls back to around 120 level, however, it may offer a good buying opportunity, with upside potential toward 150 or higher, depending on the broader macroeconomic conditions at the time.
Please also check our earlier post:
면책사항
이 정보와 게시물은 TradingView에서 제공하거나 보증하는 금융, 투자, 거래 또는 기타 유형의 조언이나 권고 사항을 의미하거나 구성하지 않습니다. 자세한 내용은 이용 약관을 참고하세요.
면책사항
이 정보와 게시물은 TradingView에서 제공하거나 보증하는 금융, 투자, 거래 또는 기타 유형의 조언이나 권고 사항을 의미하거나 구성하지 않습니다. 자세한 내용은 이용 약관을 참고하세요.