📊 Current Snapshot
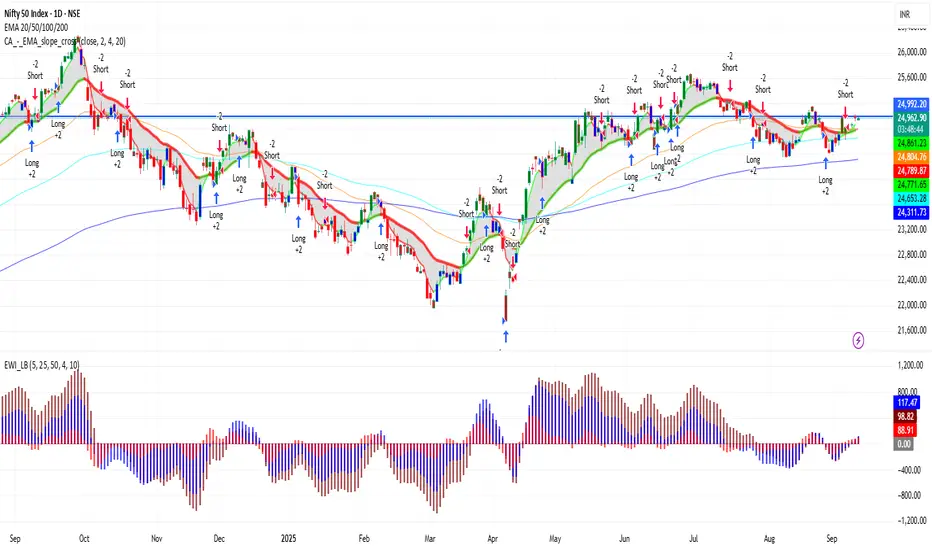
Current Price: ₹24,981
Previous Close: ₹24,960.15
Day’s Range: ₹24,915 – ₹25,035
52-Week Range: ₹21,743 – ₹26,277
Market Cap: Approx. ₹21.5 lakh crore
Volume: ~1.8 crore shares
🔑 Key Support & Resistance Levels
Immediate Support: ₹24,900
Next Support: ₹24,500
Immediate Resistance: ₹25,050
Next Resistance: ₹25,200
📈 Trend & Indicators
Trend: Neutral to mildly bullish; trading near 50-day and 200-day moving averages.
RSI (14): 65 – approaching overbought zone.
MACD: Positive, indicating bullish momentum.
Moving Averages: Short-term moving averages suggest neutral to slightly bullish outlook.
🔮 Outlook
Bullish Scenario: Break above ₹25,050 with strong volume could push Nifty toward ₹25,200.
Bearish Scenario: Drop below ₹24,900 may lead to further decline toward ₹24,500.
Neutral Scenario: Consolidation between ₹24,900 – ₹25,050; breakout needed for directional move.
📌 Key Factors to Watch
Broader market sentiment.
Economic indicators such as interest rates and inflation.
Global cues affecting investor confidence.
관련 발행물
면책사항
해당 정보와 게시물은 금융, 투자, 트레이딩 또는 기타 유형의 조언이나 권장 사항으로 간주되지 않으며, 트레이딩뷰에서 제공하거나 보증하는 것이 아닙니다. 자세한 내용은 이용 약관을 참조하세요.
관련 발행물
면책사항
해당 정보와 게시물은 금융, 투자, 트레이딩 또는 기타 유형의 조언이나 권장 사항으로 간주되지 않으며, 트레이딩뷰에서 제공하거나 보증하는 것이 아닙니다. 자세한 내용은 이용 약관을 참조하세요.