On January 22, Netflix presented results that widely beat market estimates:
--> Sales 10,247 million dollars (+16% YoY) vs. 10,106 million dollars estimated by the consensus and 10,128 million dollars estimated by the company.
--> EBIT 2,243 million dollars (+52%) vs. 2,200 million dollars consensus and 2,190 million dollars estimated by the company.
--> BNA 1,869 million dollars (+99%) vs. 1,830 million dollars consensus and 1,847 million dollars estimated by the company.
--> EPS 4.27 dollars (+102%) vs. 4.18 dollars consensus and 4.23 dollars estimated by the company.
New subscriptions reach +18.9M, +44% YoY, vs. +9.2M expected. As anticipated by the Company, this is the last quarter in which it will publish this data. Total subscriptions exceed 301M (+15.9% YoY).
-----------------------------------------------------------------
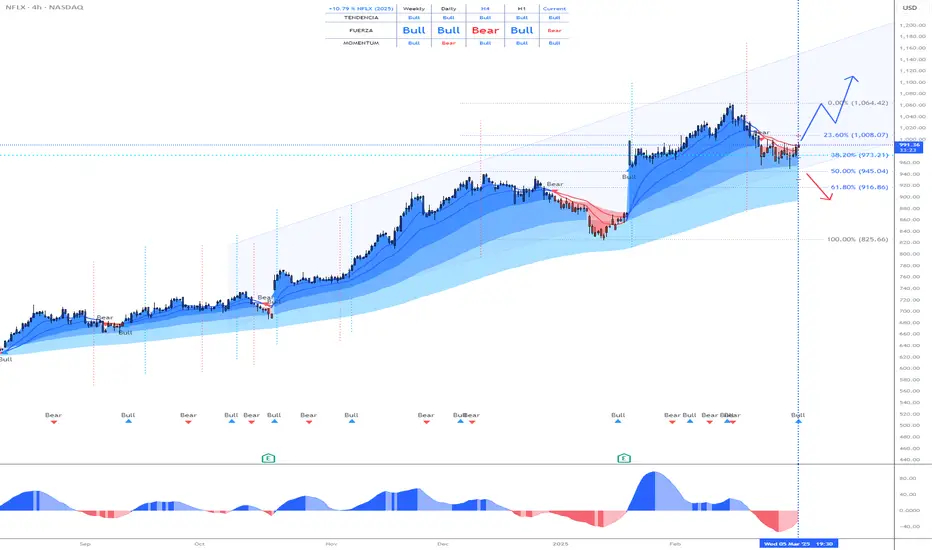
The share price reached its historical maximum on February 18th at 1,064 and has not stopped falling since then, due to the fact that the Nasdaq index began a correction caused mainly by the volatility generated by trade tariffs.
--> What is the technical situation?
The technical aspect is CLEARLY BULLISH and any setback in the price will be a good opportunity to enter the stock.
It has reached a 50% Fibonacci retracement (945), an area that it has respected, and that therefore, can be taken as the LOWER to start a NEW BULLISH IMPULSE.
--> What risks does it have?
Trump's TARIFFS, since they can cause falls in the NASDAQ INDEX that drag down the entire market. But the Nasdaq index is in a VERY PROBABLE LOWER area, so the ENTIRE market could rise strongly in the next few days.
-------------------------------------
Strategy to follow:
ENTRY: We will open 2 long positions if the H4 candle closes above 992
POSITION 1 (TP1): We close the first position in the maximum area (1,061) (+7%)
--> Stop Loss at 940 (-5%).
POSITION 2 (TP2): We open a Trailing Stop type position.
--> Initial dynamic Stop Loss at (-5%) (coinciding with the 940 of position 1).
--> We modify the dynamic Stop Loss to (-1%) when the price reaches TP1 (1,061).
-------------------------------------------
SET UP EXPLANATIONS
*** How do we know which 2 long positions to open? Let's take an example: If we want to invest 2,000 euros in the stock, what we do is divide that amount by 2, and instead of opening 1 position of 2,000, we will open 2 positions of 1,000 each.
*** What is a Trailing Stop? A Trailing Stop allows a trade to continue gaining value when the market price moves in a favorable direction, but automatically closes the trade if the market price suddenly moves in an unfavorable direction by a certain distance. That certain distance is the dynamic Stop Loss.
-->Example: If the dynamic Stop Loss is at -1%, it means that if the price drops by -1%, the position will be closed. If the price rises, the Stop Loss also rises to maintain that -1% in the rises, therefore, the risk is increasingly lower until the position becomes profitable. In this way, very solid and stable price trends can be taken advantage of, maximizing profits.
면책사항
해당 정보와 게시물은 금융, 투자, 트레이딩 또는 기타 유형의 조언이나 권장 사항으로 간주되지 않으며, 트레이딩뷰에서 제공하거나 보증하는 것이 아닙니다. 자세한 내용은 이용 약관을 참조하세요.
면책사항
해당 정보와 게시물은 금융, 투자, 트레이딩 또는 기타 유형의 조언이나 권장 사항으로 간주되지 않으며, 트레이딩뷰에서 제공하거나 보증하는 것이 아닙니다. 자세한 내용은 이용 약관을 참조하세요.