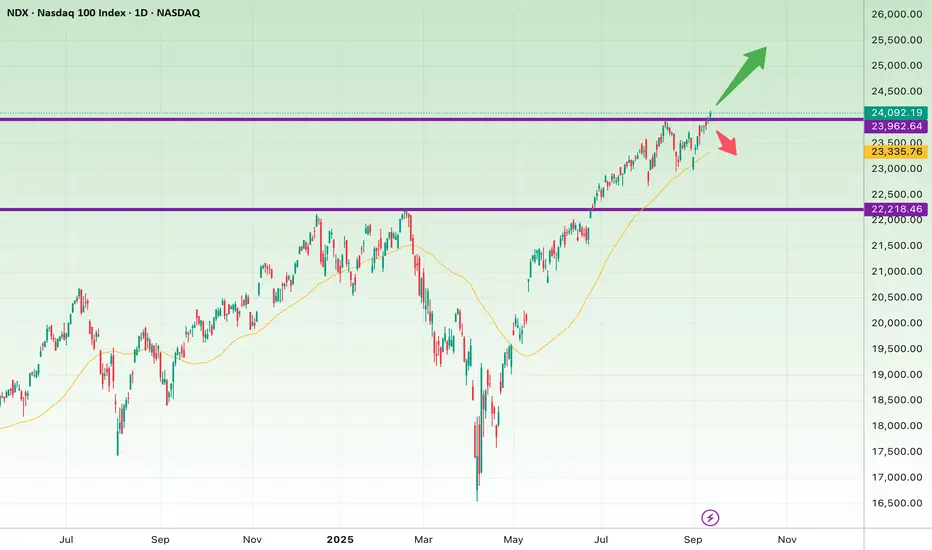
The NDX chart shows that after a strong rally from the 22,200 support zone, the index is now testing a key resistance around 23,950 – 24,100.
Bullish Scenario:
If the daily or weekly candle closes firmly above 24,100, the path opens toward 24,800 – 25,000. Breaking this resistance could trigger a new wave of buying momentum.
Bearish Scenario:
If the index fails to break higher and sellers step in, we may see a pullback toward 23,500 and possibly 22,200.
The 50-day moving average (yellow line) near 23,300 – 23,400 will act as an important mid-term support.
Conclusion:
The market is at a decisive turning point. A breakout above 24,100 signals continuation of the bull run, while rejection here could trigger a deeper correction.
면책사항
이 정보와 게시물은 TradingView에서 제공하거나 보증하는 금융, 투자, 거래 또는 기타 유형의 조언이나 권고 사항을 의미하거나 구성하지 않습니다. 자세한 내용은 이용 약관을 참고하세요.
면책사항
이 정보와 게시물은 TradingView에서 제공하거나 보증하는 금융, 투자, 거래 또는 기타 유형의 조언이나 권고 사항을 의미하거나 구성하지 않습니다. 자세한 내용은 이용 약관을 참고하세요.