Hi Traders,
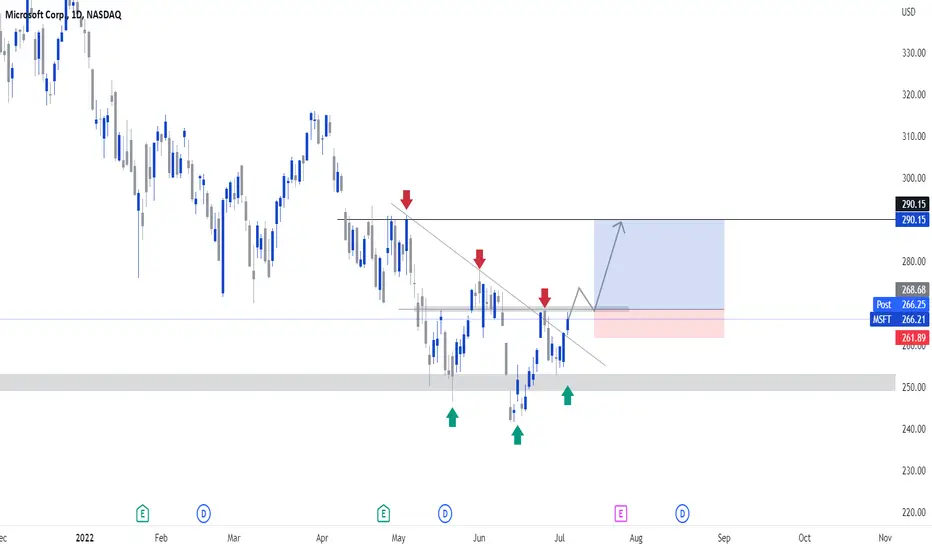
Microsoft seems to be gaining some strength. Could this be the start of a bullish move? Only time will tell. Price started creating an Inverse head and shoulders pattern which could be the first sign of a reversal. On the monthly, I have mapped out a level of 250.0 which is an order block that was never tested.
Price then proceeds to create the reversal pattern. We also see that we have now started breaking my descending trend line but it meets a previous resistance level. A break and close above this level is what captures my interest as this could give an easy move to upside upon a retest.
Keep in mind that we are still in a bear market and this could just be a pullback for the bearish continuation so I will be extremely aggressive in managing my position should I take one.
The key reason why I am optimistic is because the Pattern has created a lower high which could fuel the bulls to break the resistance of 168.95. this would also then create a new higher high. Very simple structural movement but yet very powerful in most markets. The next key play would be the pullback after the break which needs to form some sort of support and give signs of exhaustion to fuel another bullish leg.
The next point of interest in my radar will be 290.15 where I will look to take profit. As previously mentioned this is still a counter-trend move and that needs to remain at the back of the mind.
I hope this breakdown has been helpful and feel free to comment your thoughts on this analysis.
Best wishes,
Renaldo Philander.
면책사항
이 정보와 게시물은 TradingView에서 제공하거나 보증하는 금융, 투자, 거래 또는 기타 유형의 조언이나 권고 사항을 의미하거나 구성하지 않습니다. 자세한 내용은 이용 약관을 참고하세요.
면책사항
이 정보와 게시물은 TradingView에서 제공하거나 보증하는 금융, 투자, 거래 또는 기타 유형의 조언이나 권고 사항을 의미하거나 구성하지 않습니다. 자세한 내용은 이용 약관을 참고하세요.