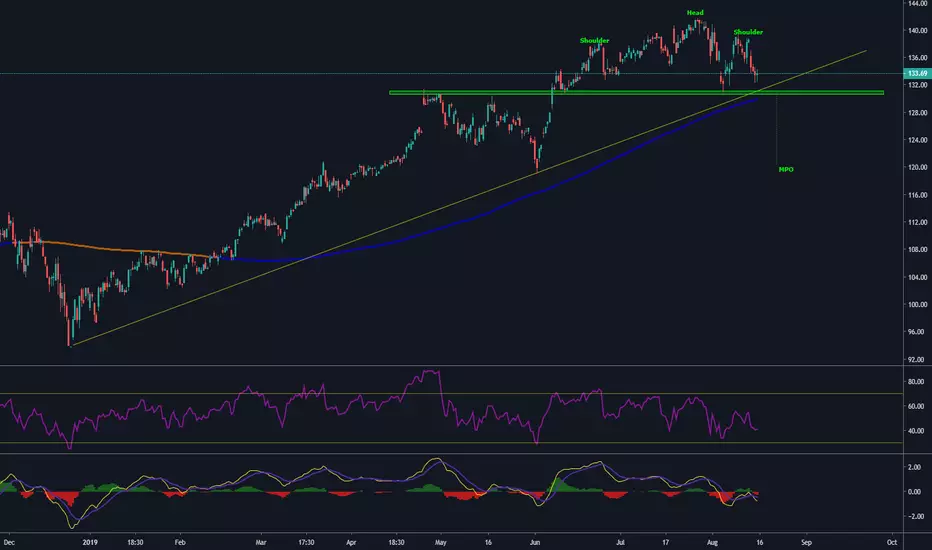
Chart analysis shows H&S pattern forming with divergence on both MACD and RSI. MPO target $120 support area and 200SMA on a daily chart (see in comments). First needs a good break through the trend line and 200SMA, quite strong support area around $130 level. If the market sell off continues next week, it could be the trigger for the pattern.
On the fundamental side major banks and investment funds see the stock as 'neutral-buy' and split price targets ranging from $115 to $160. Good Luck!
On the fundamental side major banks and investment funds see the stock as 'neutral-buy' and split price targets ranging from $115 to $160. Good Luck!
노트
면책사항
해당 정보와 게시물은 금융, 투자, 트레이딩 또는 기타 유형의 조언이나 권장 사항으로 간주되지 않으며, 트레이딩뷰에서 제공하거나 보증하는 것이 아닙니다. 자세한 내용은 이용 약관을 참조하세요.
면책사항
해당 정보와 게시물은 금융, 투자, 트레이딩 또는 기타 유형의 조언이나 권장 사항으로 간주되지 않으며, 트레이딩뷰에서 제공하거나 보증하는 것이 아닙니다. 자세한 내용은 이용 약관을 참조하세요.