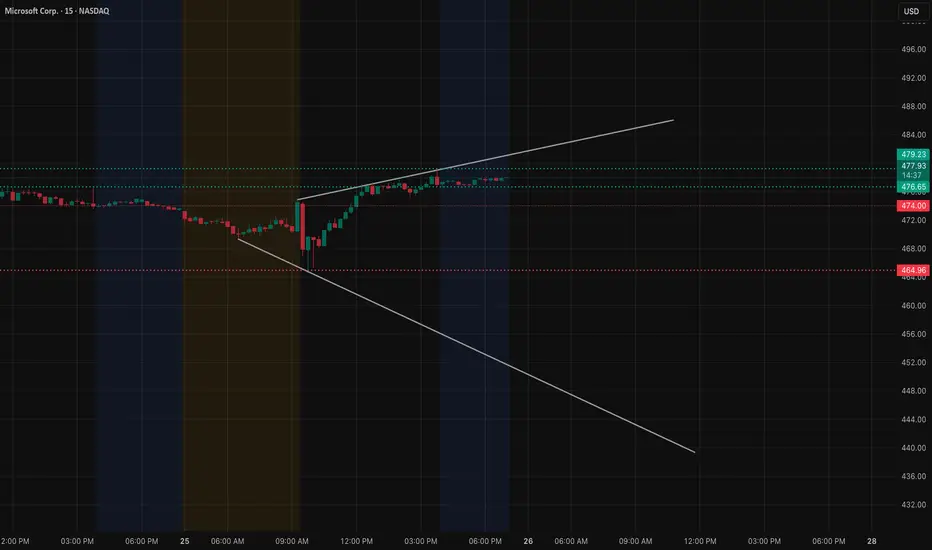
MSFT spent most of the session stuck inside that tight 475–478 pocket. It never really committed in either direction, and when a stock trades like this, it usually means bigger players are positioning quietly ahead of the next move. The recovery off the morning shakeout was solid, but every attempt toward 478 kept getting absorbed. That kind of steady rejection usually hints that there’s something sitting overhead — not sellers necessarily, but hedging pressure.
On the 15-minute view, you can see how controlled the move has been. Nothing impulsive, nothing sloppy. Just slow buying with shallow pullbacks, then that familiar hesitation right under the ceiling. The candles toward the end of the day say a lot: smaller bodies, slower pace, and a clear unwillingness to push into that resistance.
If you check the 1-hour GEX chart I uploaded below, the reason for that hesitation becomes pretty obvious. There are heavy call walls stacked right above price. That whole stretch from 479 into the low 480s is packed with hedging resistance, which usually acts like a lid until volume picks up. Below price, the GEX landscape is cleaner — good put support around 470 and deeper at 465 — which explains why MSFT hasn’t been eager to unwind.
So for Nov 26, I’m mainly watching two things:
A clean break above 478 gives MSFT a chance to move into 479, and if that gets taken out with real momentum, then 482.5 becomes the next logical magnet. But if price stays stuck under that band, it’s just more coiling.
If MSFT loses 475 and stays below it, then the market probably wants to revisit 472 or even 470 to reload.
Option Angle
Calls only make sense if price can finally get above 478 with strength — that’s where the air pockets sit between GEX levels. MSFT usually moves quickly when it clears a hedging cluster.
Puts only make sense if 475 breaks cleanly. Below that, 472 and 470 open up. If MSFT stays above 475, puts decay fast because the structure leans bullish.
Disclaimer
This is not financial advice. It’s just my personal view based on chart behavior and options data. Always trade your own plan and manage your risk.
면책사항
해당 정보와 게시물은 금융, 투자, 트레이딩 또는 기타 유형의 조언이나 권장 사항으로 간주되지 않으며, 트레이딩뷰에서 제공하거나 보증하는 것이 아닙니다. 자세한 내용은 이용 약관을 참조하세요.
면책사항
해당 정보와 게시물은 금융, 투자, 트레이딩 또는 기타 유형의 조언이나 권장 사항으로 간주되지 않으며, 트레이딩뷰에서 제공하거나 보증하는 것이 아닙니다. 자세한 내용은 이용 약관을 참조하세요.