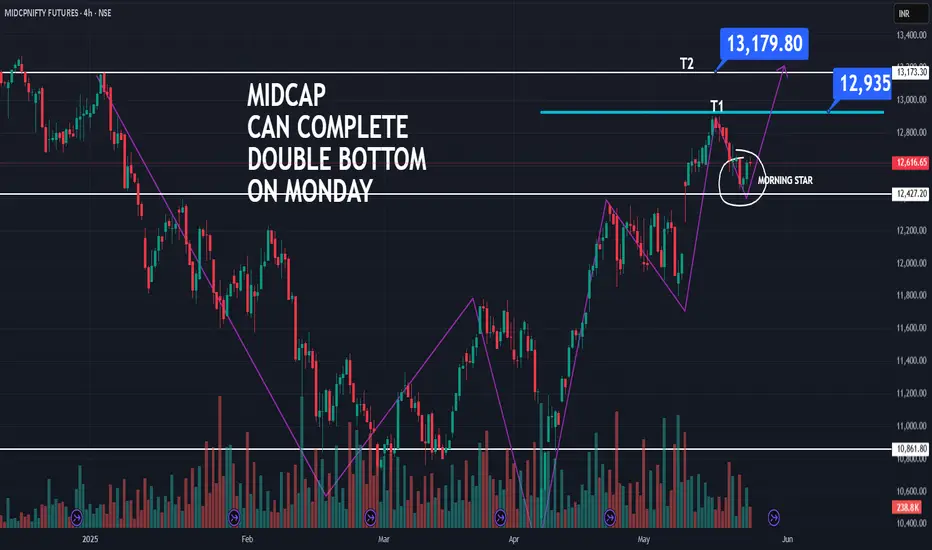
A double bottom pattern is a classic technical analysis charting formation that represents a major change in trend and a momentum reversal from a prior down move in market trading. It describes the drop of a security or index, a rebound, another drop to the same or similar level as the original drop, and finally another rebound (that may become a new uptrend). The double bottom looks like the letter "W." The twice-touched low is now considered a significant support level. While those two lows hold, the upside has new potential.
1
Rivkin Securities. "Technical Analysis: Double Bottom Patterns."
In terms of profit targets, a conservative reading of the pattern suggests the minimum-move price target is equal to the distance of the two lows and the intermediate high. More aggressive targets are double the distance between the two lows and the intermediate high.
면책사항
해당 정보와 게시물은 금융, 투자, 트레이딩 또는 기타 유형의 조언이나 권장 사항으로 간주되지 않으며, 트레이딩뷰에서 제공하거나 보증하는 것이 아닙니다. 자세한 내용은 이용 약관을 참조하세요.
면책사항
해당 정보와 게시물은 금융, 투자, 트레이딩 또는 기타 유형의 조언이나 권장 사항으로 간주되지 않으며, 트레이딩뷰에서 제공하거나 보증하는 것이 아닙니다. 자세한 내용은 이용 약관을 참조하세요.