MATIC / USDT 1D chart
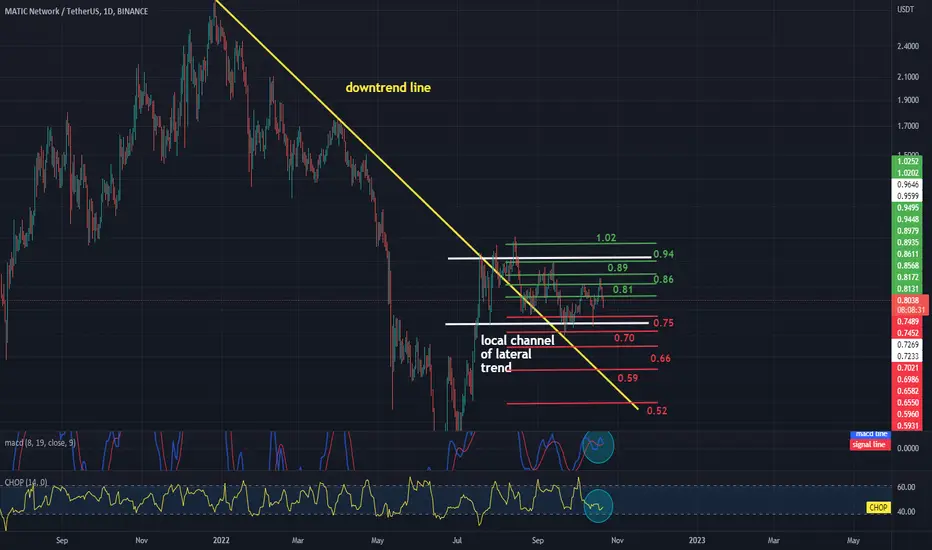
Please take a look at the MATICUSDT 1 day chart, as you can see the trend line has broken out and we are currently in the local sideways trend channel.
Now let's move on to the price support line, and as you can see, we have the first support at seventy-five cents, the next support at seventy cents, sixty-six cents, fifty-nine cents, and fifty-two cents.
Now let's see what resistance price has to face, and the first resistance is eighty-one cents, the next one at eighty-six cents, eighty-nine cents, ninety-four cents, and one dollar two cents.
Now please note the CHOP index which indicates that energy has been used up and the MACD indicator shows that we are close to entering a downtrend.
면책사항
이 정보와 게시물은 TradingView에서 제공하거나 보증하는 금융, 투자, 거래 또는 기타 유형의 조언이나 권고 사항을 의미하거나 구성하지 않습니다. 자세한 내용은 이용 약관을 참고하세요.
면책사항
이 정보와 게시물은 TradingView에서 제공하거나 보증하는 금융, 투자, 거래 또는 기타 유형의 조언이나 권고 사항을 의미하거나 구성하지 않습니다. 자세한 내용은 이용 약관을 참고하세요.