롱
MATIC: Support Breakout
Polygon (MATIC) technical analysis:
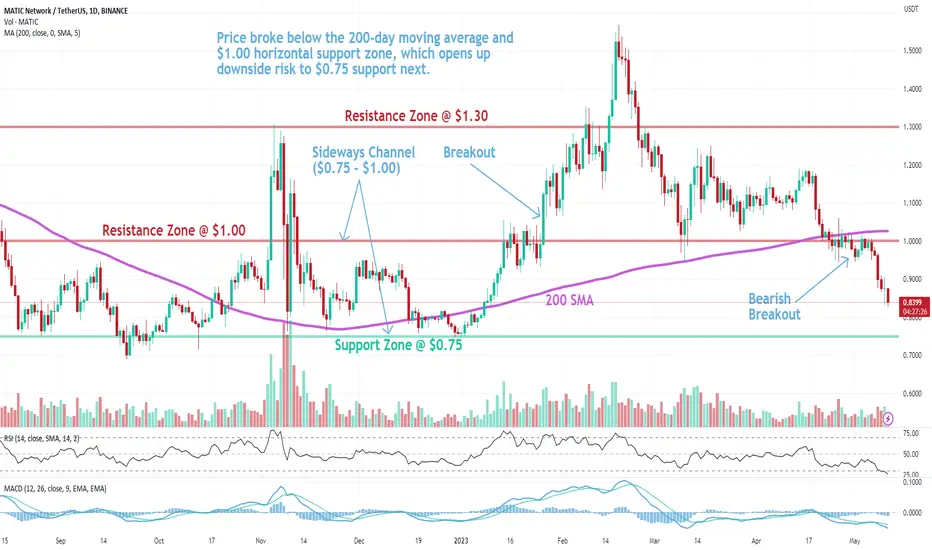
Trade setup: Price broke below the 200-day moving average and $1.00 horizontal support zone, which opens up downside risk to $0.75 support next.
Trend: Downtrend across all time horizons (Short- Medium- and Long-Term).
Momentum is Bearish (MACD Line is below MACD Signal Line, and RSI is below 45).
Support and Resistance: Nearest Support Zone is $0.75. The nearest Resistance Zone is $1.00 (previous support), then $1.30.
면책사항
이 정보와 게시물은 TradingView에서 제공하거나 보증하는 금융, 투자, 거래 또는 기타 유형의 조언이나 권고 사항을 의미하거나 구성하지 않습니다. 자세한 내용은 이용 약관을 참고하세요.
면책사항
이 정보와 게시물은 TradingView에서 제공하거나 보증하는 금융, 투자, 거래 또는 기타 유형의 조언이나 권고 사항을 의미하거나 구성하지 않습니다. 자세한 내용은 이용 약관을 참고하세요.