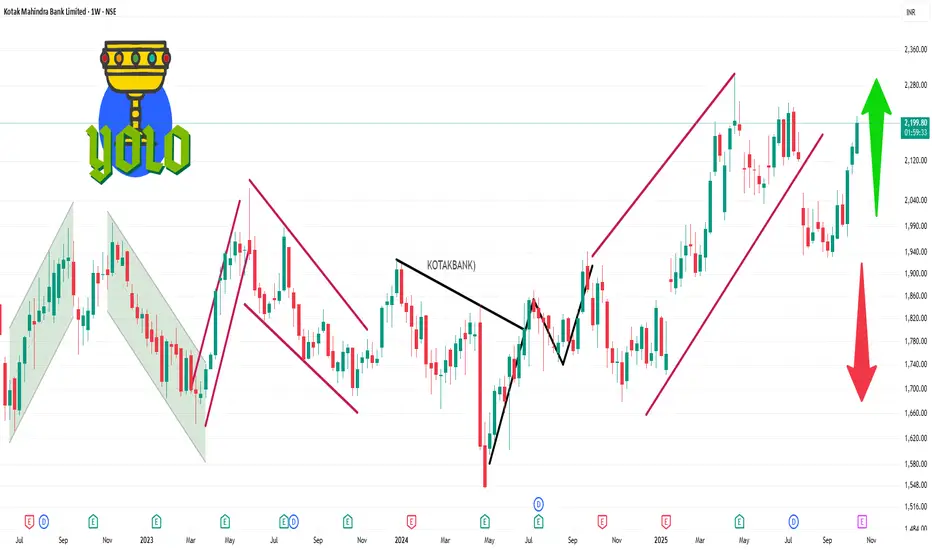
📊 Weekly Support and Resistance Levels
Immediate Support Levels: ₹2,109.47, ₹2,068.83, ₹2,044.67
Immediate Resistance Levels: ₹2,174.27, ₹2,198.43, ₹2,239.07
A decisive move above ₹2,174.27 could signal a bullish breakout, while a drop below ₹2,109.47 may indicate a bearish trend.
📈 Technical Indicators Summary
RSI (14): 73.44 — Indicates potential overbought conditions.
MACD: 46.92 — Suggests bullish momentum.
ADX (14): 32.50 — Reflects a strong trend.
EMA (5): ₹2,176.59 — Indicates short-term bullishness.
EMA (50): ₹2,067.60 — Supports medium-term bullish outlook.
EMA (200): ₹2,057.89 — Confirms long-term bullish trend.
관련 발행물
면책사항
해당 정보와 게시물은 금융, 투자, 트레이딩 또는 기타 유형의 조언이나 권장 사항으로 간주되지 않으며, 트레이딩뷰에서 제공하거나 보증하는 것이 아닙니다. 자세한 내용은 이용 약관을 참조하세요.
관련 발행물
면책사항
해당 정보와 게시물은 금융, 투자, 트레이딩 또는 기타 유형의 조언이나 권장 사항으로 간주되지 않으며, 트레이딩뷰에서 제공하거나 보증하는 것이 아닙니다. 자세한 내용은 이용 약관을 참조하세요.