As of May 1, 2025, at 10:20 AM IST, ITC Ltd (NSE: ITC) is trading at ₹403.05. Based on recent technical analysis, here are the key support and resistance levels for the stock on a weekly (1W) chart:
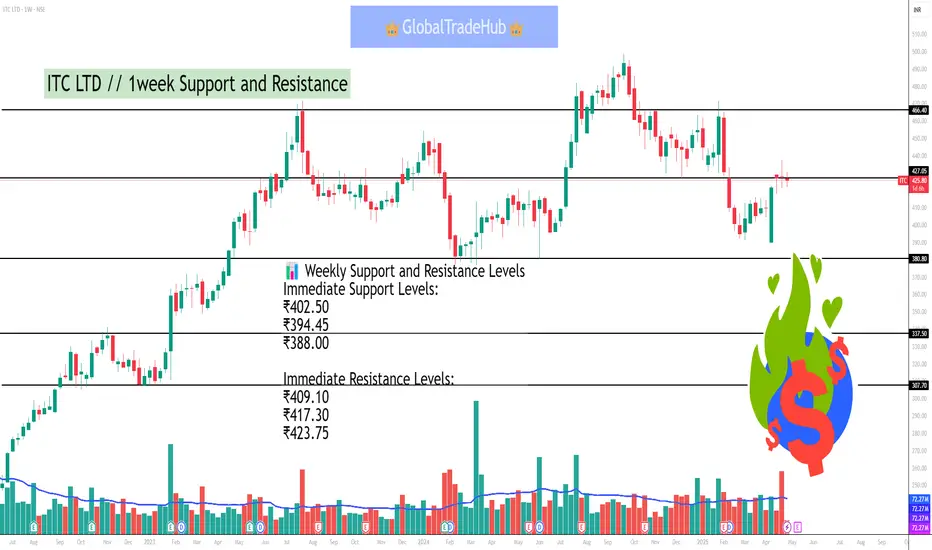
📊 Weekly Support and Resistance Levels
Immediate Support Levels:
₹402.50
₹394.45
₹388.00
Immediate Resistance Levels:
₹409.10
₹417.30
₹423.75
These levels suggest that if the stock price declines below ₹402.50, it may find support around ₹394.45 and ₹388.00. Conversely, if the price rises above ₹409.10, it could encounter resistance near ₹417.30 and ₹423.75.
🔍 Technical Indicators
ADX (Average Directional Index): 29.19 – indicates a trending market.
RSI (Relative Strength Index): 47.4 – suggests neutral momentum.
MACD (Moving Average Convergence Divergence): -4.66 – indicates a negative trend.
CCI (Commodity Channel Index): 2.74 – suggests neutral momentum.
These indicators suggest a neutral to slightly bearish outlook for ITC in the short term.
📈 Summary
ITC is currently trading near its immediate support levels. A break below ₹402.50 could lead to a decline towards ₹394.45 and ₹388.00. On the upside, resistance is observed at ₹409.10, ₹417.30, and ₹423.75. Traders should monitor these levels closely, as a decisive move beyond these support or resistance levels could signal the next directional move.
관련 발행물
면책사항
해당 정보와 게시물은 금융, 투자, 트레이딩 또는 기타 유형의 조언이나 권장 사항으로 간주되지 않으며, 트레이딩뷰에서 제공하거나 보증하는 것이 아닙니다. 자세한 내용은 이용 약관을 참조하세요.
관련 발행물
면책사항
해당 정보와 게시물은 금융, 투자, 트레이딩 또는 기타 유형의 조언이나 권장 사항으로 간주되지 않으며, 트레이딩뷰에서 제공하거나 보증하는 것이 아닙니다. 자세한 내용은 이용 약관을 참조하세요.