STOCK TREND - BULLISH
MULTI TF ANALYSIS
==================
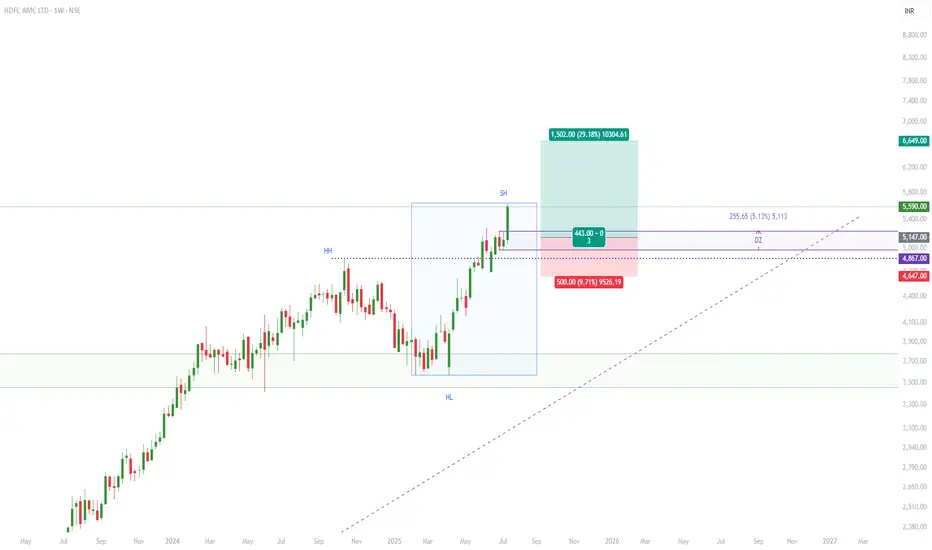
MONTHLY - Strong Uptrend
WEEKLY - Recent BoS breakout after consolidation
DAILY - NA
TECHNICAL ANALYSIS
===================
Stock Price is trading above [50, 100, 200] SMAs
RSI > [60]
Support/Resistance Zone - [4700 - 4864]
Demand Zone - [4984 - 5233.50]
Observation - Recent BoS breakout has been confirmed along with RSI and Volume confirmation on WEEKLY chart.
FUNDAMENTAL ANALYSIS
======================
Compounded Sales Growth - [33%]
Compounded Profit Growth - [26%]
Stock Price CAGR - [37%]
Return on Equity - [32%]
Note: The stock is currently fairly valued as Stock PE(29.05) > Industry PE(19.66).
POTENTIAL TRADE PLAN
=============
ENTRY - [5147]
SL - [4647]
TARGET - [6649]
RRR - [1:3]
Disclaimer: This chart study is for educational purpose only. Please don't consider this as an advice and kindly trade at your own risk.
면책사항
이 정보와 게시물은 TradingView에서 제공하거나 보증하는 금융, 투자, 거래 또는 기타 유형의 조언이나 권고 사항을 의미하거나 구성하지 않습니다. 자세한 내용은 이용 약관을 참고하세요.
면책사항
이 정보와 게시물은 TradingView에서 제공하거나 보증하는 금융, 투자, 거래 또는 기타 유형의 조언이나 권고 사항을 의미하거나 구성하지 않습니다. 자세한 내용은 이용 약관을 참고하세요.