🔍Technical Analysis
HBL Engineering has showcased remarkable technical progression over the past 2+ years. The stock crossed ₹100 levels in June 2022 and embarked on an extraordinary journey, surging directly to ₹724 by August 2024 - representing a phenomenal 7.2x growth in just over 2 years.
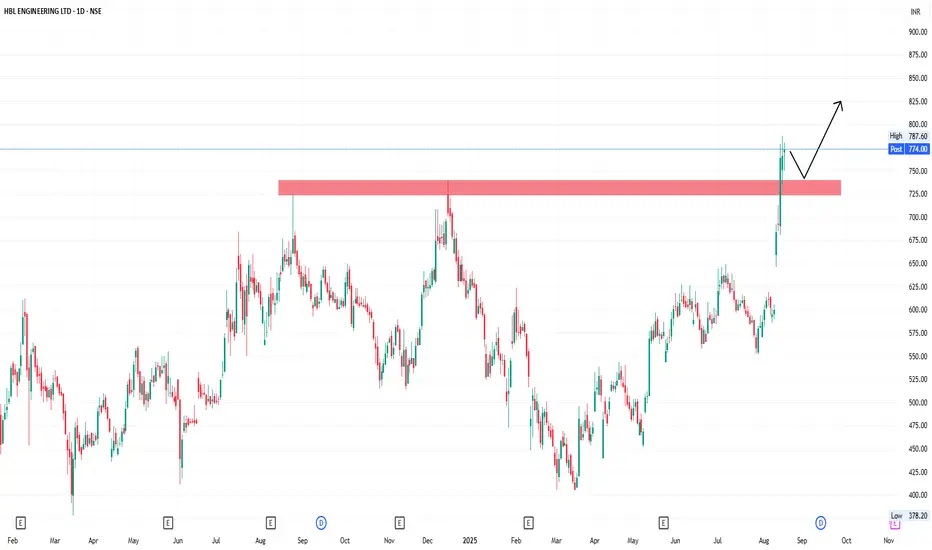
The ₹724 all-time high level acted as formidable resistance multiple times, causing the stock to correct sharply to ₹400 levels. However, the game-changing moment arrived with the announcement of massive strong Q1 FY26 results, which triggered a powerful breakout.
The stock shot up decisively, breaking above the stubborn ₹724 resistance level and is now trading at ₹765. With bullish candlestick patterns emerging and the previous resistance potentially acting as new support, the technical setup appears highly favorable.
Entry Strategy: Enter on any dips toward ₹724-₹740 range, ensuring the old resistance holds as new support.
Targets:
🎯Target 1: ₹800
🎯Target 2: ₹850
🎯Target 3: ₹900
Stop Losses:
🚫Critical Stop: ₹724 (previous resistance, now key support)
If ₹724 resistance doesn't sustain as support, no more expectations on this stock.
💰Q1 FY26 Financial Highlights (vs Q4 FY25 & Q1 FY25)
HBL Engineering delivered record-breaking Q1 FY26 performance with PAT surging an exceptional 218% QoQ and 79% YoY to ₹143 crore, driven by strong Electronics division growth. The company posted record Q1 profits triggering a 14% stock price surge.
Market cap stands at ₹21,223 crore (up 19.8% in 1 year) with stable promoter holding of 59.1%. Annual revenue of ₹2,049 crore with profit of ₹340 crore demonstrates consistent business growth. Stock trades at 14.3 times book value indicating reasonable valuation.
The Electronics division has emerged as a key growth driver, contributing significantly to the exceptional quarterly performance. Company's mission-critical electronics systems and solutions business is well-positioned for sustained growth.
Operating profit margins expanded dramatically from 21% in Q1 FY25 to 32% in Q1 FY26, showcasing superior operational efficiency. The company gained 67% from March lows, indicating strong recovery momentum.
Cost management excellence reflected in flat expense growth while revenue surged 26% QoQ, demonstrating operational leverage benefits. Strong balance sheet fundamentals support the technical breakout thesis.
✅Conclusion
HBL Engineering's spectacular 218% QoQ PAT surge and successful breakout above ₹724 resistance creates a compelling technical and fundamental convergence. The record Q1 profits triggering 14% stock surge validates the breakout momentum. With Electronics division growth driving performance and strong operational leverage, the stock appears well-positioned for the ₹900 target zone. Critical support at ₹724 must hold for sustained bullish trajectory.
HBL Engineering has showcased remarkable technical progression over the past 2+ years. The stock crossed ₹100 levels in June 2022 and embarked on an extraordinary journey, surging directly to ₹724 by August 2024 - representing a phenomenal 7.2x growth in just over 2 years.
The ₹724 all-time high level acted as formidable resistance multiple times, causing the stock to correct sharply to ₹400 levels. However, the game-changing moment arrived with the announcement of massive strong Q1 FY26 results, which triggered a powerful breakout.
The stock shot up decisively, breaking above the stubborn ₹724 resistance level and is now trading at ₹765. With bullish candlestick patterns emerging and the previous resistance potentially acting as new support, the technical setup appears highly favorable.
Entry Strategy: Enter on any dips toward ₹724-₹740 range, ensuring the old resistance holds as new support.
Targets:
🎯Target 1: ₹800
🎯Target 2: ₹850
🎯Target 3: ₹900
Stop Losses:
🚫Critical Stop: ₹724 (previous resistance, now key support)
If ₹724 resistance doesn't sustain as support, no more expectations on this stock.
💰Q1 FY26 Financial Highlights (vs Q4 FY25 & Q1 FY25)
- Total Income: ₹602 Cr (↑ +26% QoQ from ₹476 Cr; ↑ +16% YoY from ₹520 Cr)
- Total Expenses: ₹410 Cr (↑ +4% QoQ from ₹396 Cr; ↑ +0% YoY from ₹410 Cr)
- Operating Profit: ₹192 Cr (↑ +143% QoQ from ₹79 Cr; ↑ +75% YoY from ₹110 Cr)
- Profit Before Tax: ₹191 Cr (↑ +169% QoQ from ₹71 Cr; ↑ +85% YoY from ₹103 Cr)
- Profit After Tax: ₹143 Cr (↑ +218% QoQ from ₹45 Cr; ↑ +79% YoY from ₹80 Cr)
- Diluted EPS: ₹5.17 (↑ +219% QoQ from ₹1.62; ↑ +79% YoY from ₹2.89)
HBL Engineering delivered record-breaking Q1 FY26 performance with PAT surging an exceptional 218% QoQ and 79% YoY to ₹143 crore, driven by strong Electronics division growth. The company posted record Q1 profits triggering a 14% stock price surge.
Market cap stands at ₹21,223 crore (up 19.8% in 1 year) with stable promoter holding of 59.1%. Annual revenue of ₹2,049 crore with profit of ₹340 crore demonstrates consistent business growth. Stock trades at 14.3 times book value indicating reasonable valuation.
The Electronics division has emerged as a key growth driver, contributing significantly to the exceptional quarterly performance. Company's mission-critical electronics systems and solutions business is well-positioned for sustained growth.
Operating profit margins expanded dramatically from 21% in Q1 FY25 to 32% in Q1 FY26, showcasing superior operational efficiency. The company gained 67% from March lows, indicating strong recovery momentum.
Cost management excellence reflected in flat expense growth while revenue surged 26% QoQ, demonstrating operational leverage benefits. Strong balance sheet fundamentals support the technical breakout thesis.
✅Conclusion
HBL Engineering's spectacular 218% QoQ PAT surge and successful breakout above ₹724 resistance creates a compelling technical and fundamental convergence. The record Q1 profits triggering 14% stock surge validates the breakout momentum. With Electronics division growth driving performance and strong operational leverage, the stock appears well-positioned for the ₹900 target zone. Critical support at ₹724 must hold for sustained bullish trajectory.
면책사항
이 정보와 게시물은 TradingView에서 제공하거나 보증하는 금융, 투자, 거래 또는 기타 유형의 조언이나 권고 사항을 의미하거나 구성하지 않습니다. 자세한 내용은 이용 약관을 참고하세요.
면책사항
이 정보와 게시물은 TradingView에서 제공하거나 보증하는 금융, 투자, 거래 또는 기타 유형의 조언이나 권고 사항을 의미하거나 구성하지 않습니다. 자세한 내용은 이용 약관을 참고하세요.