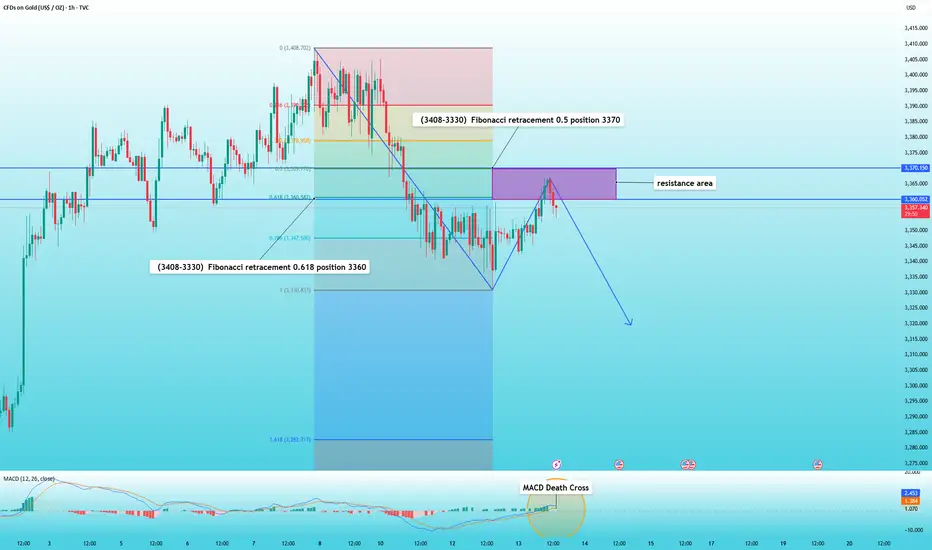
In the previous article, I said that if the gold price cannot hold above 3370 in the short term, then the gold price will continue to fall.
Today's rebound in the Asian and European sessions shows mixed gains and losses on the K-line chart, indicating a weak rebound. After rebounding to 3367, gold prices turned downward again.
Meanwhile, the 1-hour MACD indicator also shows signs of forming a death cross. The Fibonacci retracement indicator from 3408 to 3330 indicates that the 0.618 level is at 3360, and the 0.5 level is at 3370. Therefore, the 3360-3370 range is currently a resistance zone.
Therefore, I still maintain my previous view that as long as it cannot hold 3370, you can short in the resistance area.
액티브 트레이드
Gold prices hit resistance and fell back as expected.관련 발행물
면책사항
이 정보와 게시물은 TradingView에서 제공하거나 보증하는 금융, 투자, 거래 또는 기타 유형의 조언이나 권고 사항을 의미하거나 구성하지 않습니다. 자세한 내용은 이용 약관을 참고하세요.
면책사항
이 정보와 게시물은 TradingView에서 제공하거나 보증하는 금융, 투자, 거래 또는 기타 유형의 조언이나 권고 사항을 의미하거나 구성하지 않습니다. 자세한 내용은 이용 약관을 참고하세요.
