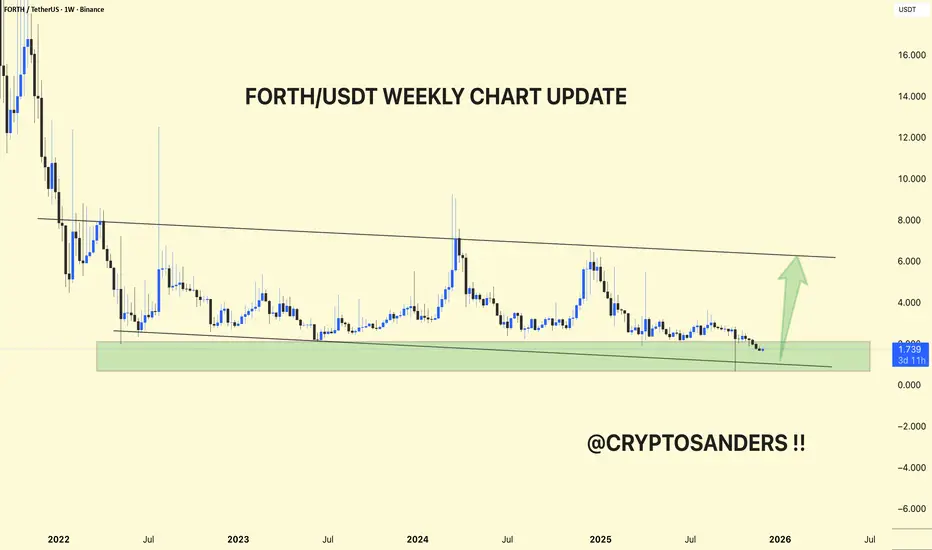
The weekly chart, FORTH/USDT, is still in a prolonged downtrend, but is once again within a large demand zone where previous rallies originated.
The price has been trending down below a major downward resistance line since 2022, with each upward impulse failing near that trendline and then retracing back to the same green support band around 1.4–2.0 USDT.
The latest candles have been holding within this green zone and the slightly rising underlying trendline, making this area a key higher-timeframe accumulation and invalidation zone for the pair.
As long as green support holds, a technical bounce towards downward resistance near 5–6 USDT remains a realistic medium-term scenario, matching the upward arrow on your chart.
A clean weekly close below the green band would break the multi-year base and create room for new lows, so risk on any long bias should be strictly managed below that zone.
DYOR | NFA
관련 발행물
면책사항
해당 정보와 게시물은 금융, 투자, 트레이딩 또는 기타 유형의 조언이나 권장 사항으로 간주되지 않으며, 트레이딩뷰에서 제공하거나 보증하는 것이 아닙니다. 자세한 내용은 이용 약관을 참조하세요.
관련 발행물
면책사항
해당 정보와 게시물은 금융, 투자, 트레이딩 또는 기타 유형의 조언이나 권장 사항으로 간주되지 않으며, 트레이딩뷰에서 제공하거나 보증하는 것이 아닙니다. 자세한 내용은 이용 약관을 참조하세요.