Technical Snapshot:
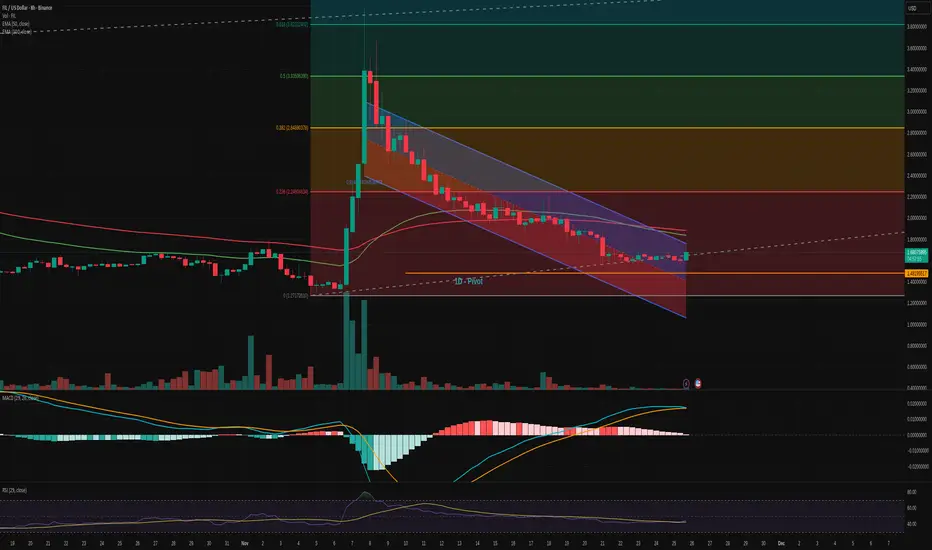
Price has broken out of a well-defined descending channel, indicating a potential shift in market structure.
Momentum indicators such as the MACD are showing early bullish crossover signals. Histogram is transitioning into positive territory, suggesting strength.
RSI (29) is recovering from a prolonged oversold phase, currently stabilizing around 45. This signals a potential momentum buildup.
Key Technical Levels:
Immediate resistance stands at the 0.236 Fibonacci retracement level around $2.25.
A successful close above this level may open the path toward the 0.382 ($2.84), 0.5 ($3.33), and 0.618 ($3.82) retracement zones.
Local support has held firm at $1.48 – a key structural level that has shown strong buying interest.
EMA Structure:
The price is currently attempting to reclaim the 50 EMA, with the 100 EMA above acting as dynamic resistance.
A clean flip of both EMAs would likely confirm bullish continuation on the mid-term.
Volume and Pivot Analysis:
Breakout volume is increasing after a period of low-volume consolidation, typically a precursor to trend acceleration.
Daily pivot levels are acting as a baseline. A reclaim and hold above the pivot supports the bullish thesis.
Conclusion:
FIL has shown a strong technical breakout from a descending structure. If the breakout sustains and key resistance levels are reclaimed, there is substantial upside potential toward higher Fibonacci retracement levels. The price action must now confirm with a follow-through above the $1.85–$2.25 region. Downside risk remains contained as long as $1.6 holds as support.
면책사항
해당 정보와 게시물은 금융, 투자, 트레이딩 또는 기타 유형의 조언이나 권장 사항으로 간주되지 않으며, 트레이딩뷰에서 제공하거나 보증하는 것이 아닙니다. 자세한 내용은 이용 약관을 참조하세요.
면책사항
해당 정보와 게시물은 금융, 투자, 트레이딩 또는 기타 유형의 조언이나 권장 사항으로 간주되지 않으며, 트레이딩뷰에서 제공하거나 보증하는 것이 아닙니다. 자세한 내용은 이용 약관을 참조하세요.