Trade idea.
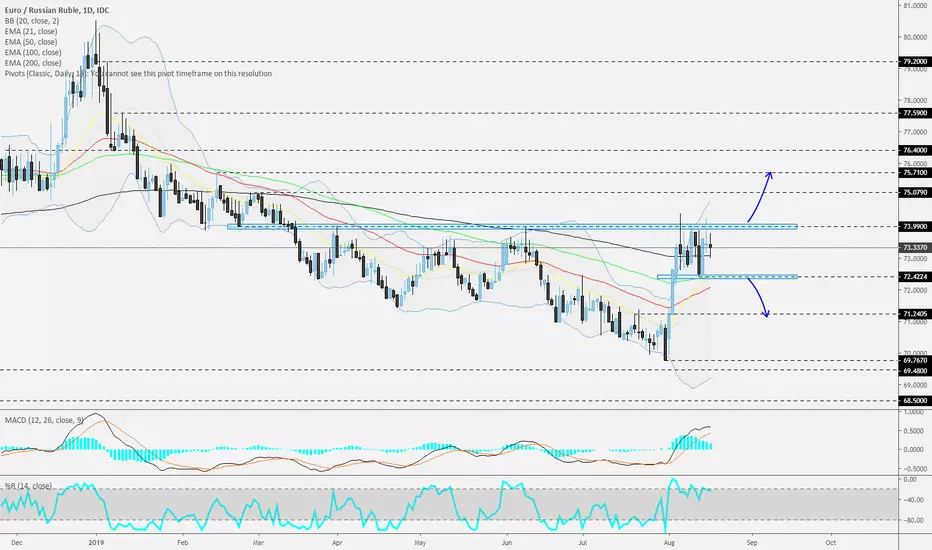
EURRUB could be forming a flag on the daily chart. Currently, the pair is sitting around its 200 EMA. For now, we will sit back, relax and wait for a clear break through one of the highlighted areas before we examine a further directional move. If the pair breaks through the 74.00 zone and closes a daily candle above it, this might confirm a possible flag and the rate may accelerate further, as more buyers could be joining in.
Please see the chart for details.
Don't forget your stop-loss.
노트
Please join our daily live quick technical market overview webinars - Trader’s Espresso and Trader’s Tea Time - on YouTube.Trader’s Espresso – 06:00 GMT
Trader’s Tea Time – 13:15 GMT
면책사항
해당 정보와 게시물은 금융, 투자, 트레이딩 또는 기타 유형의 조언이나 권장 사항으로 간주되지 않으며, 트레이딩뷰에서 제공하거나 보증하는 것이 아닙니다. 자세한 내용은 이용 약관을 참조하세요.
면책사항
해당 정보와 게시물은 금융, 투자, 트레이딩 또는 기타 유형의 조언이나 권장 사항으로 간주되지 않으며, 트레이딩뷰에서 제공하거나 보증하는 것이 아닙니다. 자세한 내용은 이용 약관을 참조하세요.