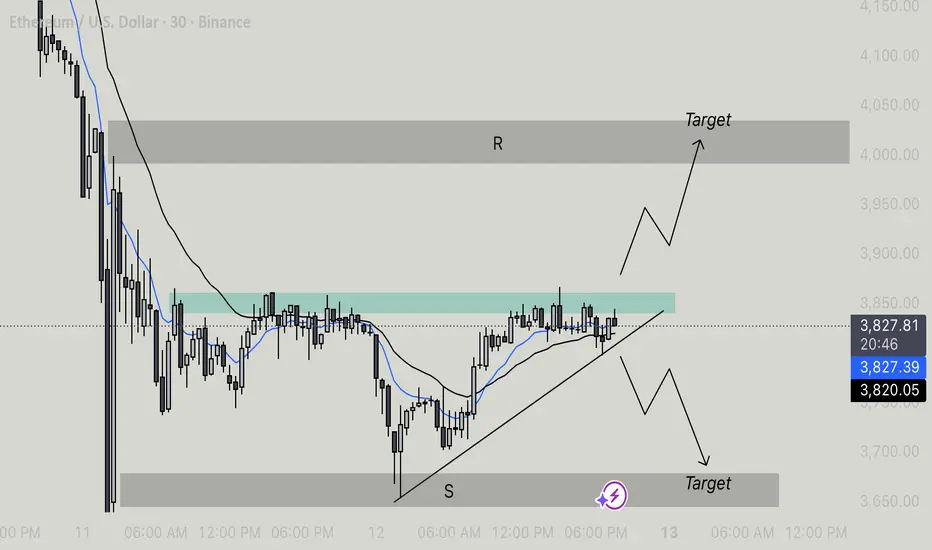
Ethereum is currently trading within an ascending triangle pattern, characterized by a horizontal resistance zone and rising trendline support. This pattern typically signals bullish continuation, though traders should watch closely for confirmation before entering a position.
Key Levels
• Resistance Zone (R): Around $3,850–$3,870, marked by repeated price rejection.
• Support Zone (S): Around $3,700–$3,720, providing strong buying interest.
• Current Price: Approximately $3,839.
Technical Outlook
• Trendline Support: ETH is respecting a clear upward-sloping trendline, showing buyers are steadily pushing higher lows.
• Horizontal Resistance: Price continues to test the $3,850 resistance area. A strong breakout and close above this level would confirm bullish momentum.
• Moving Averages: The shorter-term (blue) EMA is positioned above the longer-term (black) EMA, suggesting near-term bullish bias as long as support holds.
Scenarios
• Bullish Scenario:
If Ethereum breaks and holds above the $3,850 resistance, it could trigger a move toward the next resistance target near $4,000–$4,050. This would confirm a breakout from the ascending triangle pattern.
• Bearish Scenario:
A breakdown below the ascending trendline could lead to a retest of the $3,700 support zone or even lower toward $3,650, signaling short-term weakness.
Summary
Ethereum is consolidating just below a key resistance level within an ascending triangle. A breakout above $3,850 may open the door to further upside momentum, while a breakdown below trendline support could invalidate the bullish setup. Traders should watch for a decisive move with volume confirmation to gauge the next direction.
면책사항
이 정보와 게시물은 TradingView에서 제공하거나 보증하는 금융, 투자, 거래 또는 기타 유형의 조언이나 권고 사항을 의미하거나 구성하지 않습니다. 자세한 내용은 이용 약관을 참고하세요.
면책사항
이 정보와 게시물은 TradingView에서 제공하거나 보증하는 금융, 투자, 거래 또는 기타 유형의 조언이나 권고 사항을 의미하거나 구성하지 않습니다. 자세한 내용은 이용 약관을 참고하세요.