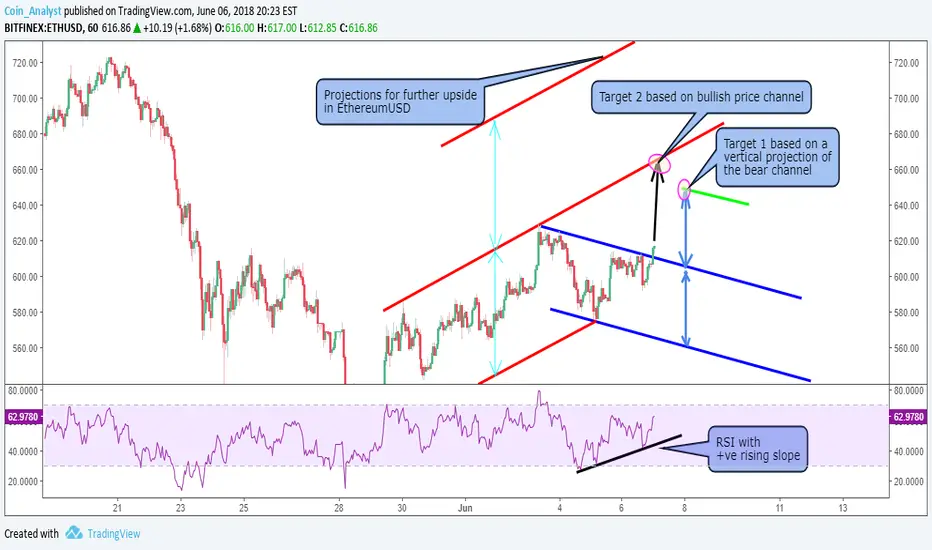
The 1hr tf chart of Ethereum (ETHUSD) as shown here captures the market action for Ethereum (ETHUSD) ever since price bottomed at ~ $511.64 on May 28, 2018.
The pink line is derived as a vertical projection of the top line (red) of the bullish channel. Further break to the upside past target 2 as shown on the chart could see Ethereum (ETHUSD) target the upper region of the pink line at ~$736.80.
Target 2 is based on price returning to the upper region of the current bullish channel and target 1 which is the most conservative is based on a vertical projection of the bear channel shown in blue.
RSI (relative strength index) as shown here has a positive rising slope and therefore implies further upside Momentum for Ethereum (ETHUSD)
면책사항
해당 정보와 게시물은 금융, 투자, 트레이딩 또는 기타 유형의 조언이나 권장 사항으로 간주되지 않으며, 트레이딩뷰에서 제공하거나 보증하는 것이 아닙니다. 자세한 내용은 이용 약관을 참조하세요.
면책사항
해당 정보와 게시물은 금융, 투자, 트레이딩 또는 기타 유형의 조언이나 권장 사항으로 간주되지 않으며, 트레이딩뷰에서 제공하거나 보증하는 것이 아닙니다. 자세한 내용은 이용 약관을 참조하세요.