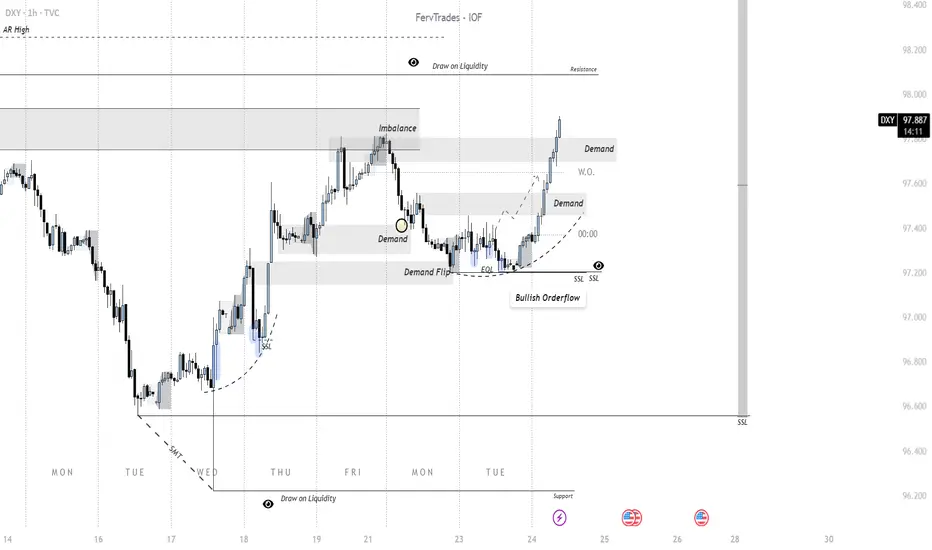
The 1H DXY chart shows a clear shift in orderflow from bearish to bullish, framed within an auction-theory context where price continuously seeks liquidity to facilitate rebalancing. Early in the week, supply overwhelmed demand, driving the dollar lower into a region of resting liquidity (sell-side liquidity/SSL). This liquidity grab served as the catalyst for demand to reassert itself, evident in the sharp recovery that flipped prior supply zones into demand. The chart highlights a demand flip and multiple demand re-entries, showing how buyers defended levels once liquidity was secured.
Auction-wise, the market auctioned downward until sellers exhausted at a support zone near SSL, where bids were reintroduced. This led to an imbalance that buyers corrected by driving higher, reclaiming inefficiencies (noted in the imbalance box). Subsequent consolidation acted as a re-auctioning phase to validate demand before continuation. Now, the bullish orderflow is steering price toward resting liquidity overhead (draw on liquidity), with demand zones forming higher as the market reprices.
In short: orderflow reveals a demand-driven transition, with the auction process shifting value upward after clearing downside liquidity. The next key behavior will be how DXY reacts once it taps into overhead resistance and whether new demand sustains the auction higher or supply reasserts.
면책사항
해당 정보와 게시물은 금융, 투자, 트레이딩 또는 기타 유형의 조언이나 권장 사항으로 간주되지 않으며, 트레이딩뷰에서 제공하거나 보증하는 것이 아닙니다. 자세한 내용은 이용 약관을 참조하세요.
면책사항
해당 정보와 게시물은 금융, 투자, 트레이딩 또는 기타 유형의 조언이나 권장 사항으로 간주되지 않으며, 트레이딩뷰에서 제공하거나 보증하는 것이 아닙니다. 자세한 내용은 이용 약관을 참조하세요.