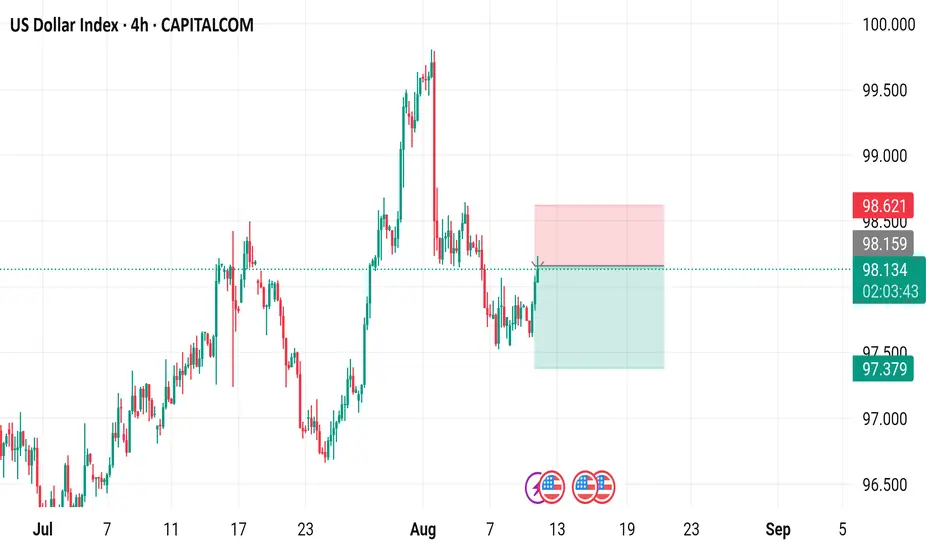
4-hour chart of the US Dollar Index (DXY) from CAPITALCOM. The chart shows the price movement of the DXY from early July to early September. The current price is 98.131 with a 0.28% increase. The chart features a candlestick pattern with green (upward movement) and red (downward movement) bars. A sell signal is indicated at 98.132, and a buy signal is at 98.186. The chart also includes highlighted zones (red and green rectangles) indicating potential trading ranges or areas of interest between approximately 98.621 and 97.379.
거래청산: 타겟 닿음
Target achieved 면책사항
해당 정보와 게시물은 금융, 투자, 트레이딩 또는 기타 유형의 조언이나 권장 사항으로 간주되지 않으며, 트레이딩뷰에서 제공하거나 보증하는 것이 아닙니다. 자세한 내용은 이용 약관을 참조하세요.
면책사항
해당 정보와 게시물은 금융, 투자, 트레이딩 또는 기타 유형의 조언이나 권장 사항으로 간주되지 않으며, 트레이딩뷰에서 제공하거나 보증하는 것이 아닙니다. 자세한 내용은 이용 약관을 참조하세요.