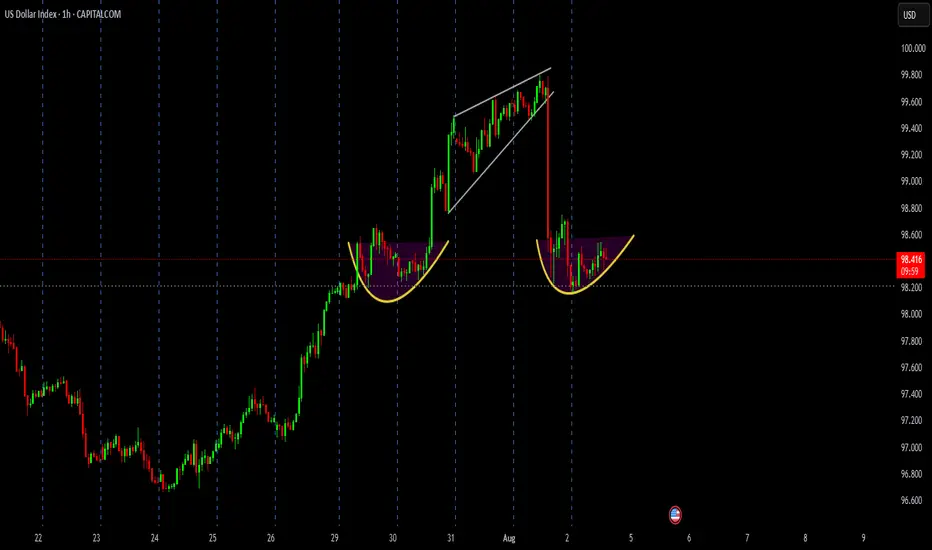
📌 Chart Patterns in Focus:
1️⃣ Cup & Handle Formation (29–31 July):
Bullish reversal pattern spotted
Price broke out sharply upwards after the handle consolidation
2️⃣ Rising Wedge Breakdown (31 July – 1 Aug):
Bearish pattern triggered heavy selling
Sharp red candle confirms strong bearish pressure
3️⃣ New Cup Base Forming (2 Aug – Present):
Price consolidating after drop
Another Cup & Handle formation in progress
Break above neckline near 98.60 could trigger next bullish wave
💡 What to Watch Next:
Breakout above 98.60 = Possible upside continuation
Failure to breakout = Range-bound or bearish retest of 98.00
📍Current Price: 98.425
⏱️ Timeframe: 1 Hour
📈 Bias: Cautiously Bullish (if neckline breaks)
📉 Risk: Another rejection may lead to 97.80 zone retest
🔔 Stay tuned for breakout confirmation before positioning!
#DXY #USDIndex #TechnicalAnalysis #ChartPatterns #ForexTrading #PriceAction #CupAndHandle #RisingWedge #SmartTrading
면책사항
이 정보와 게시물은 TradingView에서 제공하거나 보증하는 금융, 투자, 거래 또는 기타 유형의 조언이나 권고 사항을 의미하거나 구성하지 않습니다. 자세한 내용은 이용 약관을 참고하세요.
면책사항
이 정보와 게시물은 TradingView에서 제공하거나 보증하는 금융, 투자, 거래 또는 기타 유형의 조언이나 권고 사항을 의미하거나 구성하지 않습니다. 자세한 내용은 이용 약관을 참고하세요.