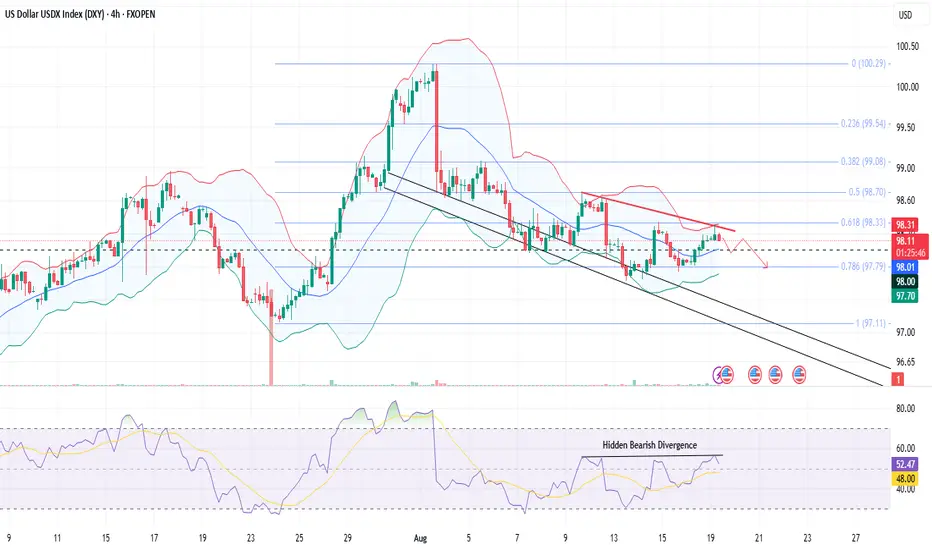
The US Dollar Index (DXY) is currently trading around 98.14, struggling near the 0.618 Fibonacci retracement at 98.33, where strong resistance has capped further upside.
The RSI shows hidden bearish divergence, signaling potential weakness despite the recent bounce.
Price action remains within a broader downtrend channel, and repeated failures to sustain above 98.30 indicate fading bullish momentum.
Immediate support is seen near 98.00, any bearish break out will lead the prices towards 97.79 (Fib 0.786), followed by 97.50, which could attract sellers if broken.
On the upside, only a decisive break above 98.33–98.70 would shift intraday sentiment bullish toward 99.08.
For today, the bias leans bearish as long as DXY trades below 98.30, with intraday traders likely eyeing short setups on rejection patterns targeting the lower supports.
면책사항
해당 정보와 게시물은 금융, 투자, 트레이딩 또는 기타 유형의 조언이나 권장 사항으로 간주되지 않으며, 트레이딩뷰에서 제공하거나 보증하는 것이 아닙니다. 자세한 내용은 이용 약관을 참조하세요.
면책사항
해당 정보와 게시물은 금융, 투자, 트레이딩 또는 기타 유형의 조언이나 권장 사항으로 간주되지 않으며, 트레이딩뷰에서 제공하거나 보증하는 것이 아닙니다. 자세한 내용은 이용 약관을 참조하세요.