📊 Technical Analysis (4H Chart – DXY)
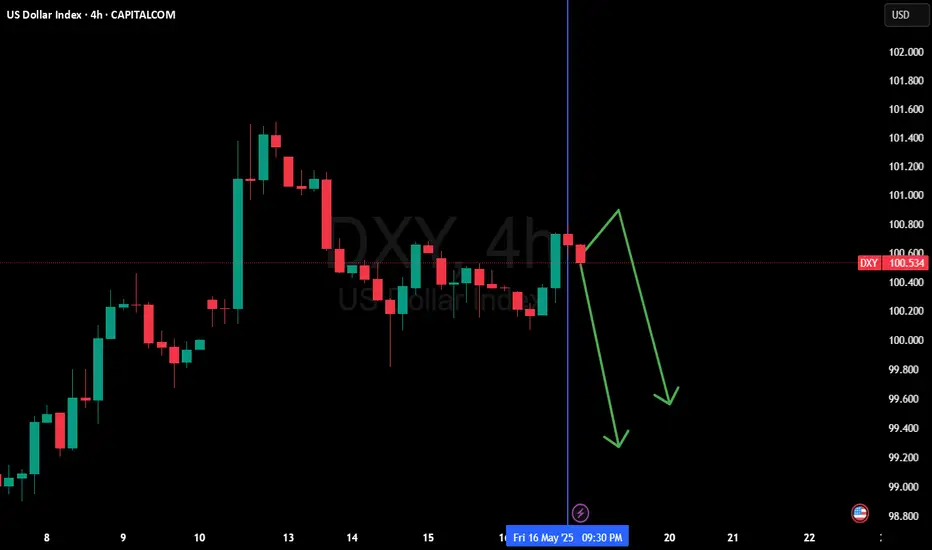
Current Price: ~100.53
Price action shows a rejection from the 100.60–100.80 zone after a minor bullish push. The structure is starting to roll over, and two potential bearish paths are illustrated with arrows heading toward 99.80 and possibly 99.30.
🔍 Key Technical Observations:
Support Zones:
• 99.80 (minor)
• 99.00 – 99.30 (major, previous reversal zone)
Resistance Zones:
• 100.50 – 100.80 (recent rejection zone)
• 101.50 – 102.00 (larger timeframe resistance)
Price appears to be forming a lower high, indicating a possible shift in momentum.
The bearish projection paths suggest potential downside movement unless bulls reclaim control above 100.80.
🔴 Bias:
Bearish short-term unless price reclaims and sustains above 100.80
🌍 Fundamental Outlook for the Week (13–17 May 2025)
🏦 1. Fed Policy Stance
The Fed remains on hold with a data-dependent approach. Persistent inflation and strong jobs data have delayed market expectations for rate cuts—supportive of USD. However, upside may be limited if inflation cools.
📈 2. Key US Data to Watch
CPI (May 15, Wed): Already released. If the print was softer than expected, it may justify the pullback seen on the chart.
Retail Sales (May 16, Thu): Key driver. Weak data could accelerate the drop toward 99.80.
Jobless Claims: Still low, but any uptick may weaken the dollar further.
💹 3. Geopolitics & Risk Sentiment
No significant escalation in global risk events. Risk sentiment remains mixed. If risk appetite strengthens and yields cool off, USD may continue lower.
✅ Conclusion
DXY outlook is bearish near-term if price remains below 100.80.
Expect potential downside toward 99.80 or even 99.30 based on chart structure.
Only a strong shift in data or sentiment (e.g., hawkish Fed remarks or geopolitical tension) could reinstate bullish momentum.
관련 발행물
면책사항
해당 정보와 게시물은 금융, 투자, 트레이딩 또는 기타 유형의 조언이나 권장 사항으로 간주되지 않으며, 트레이딩뷰에서 제공하거나 보증하는 것이 아닙니다. 자세한 내용은 이용 약관을 참조하세요.
관련 발행물
면책사항
해당 정보와 게시물은 금융, 투자, 트레이딩 또는 기타 유형의 조언이나 권장 사항으로 간주되지 않으며, 트레이딩뷰에서 제공하거나 보증하는 것이 아닙니다. 자세한 내용은 이용 약관을 참조하세요.