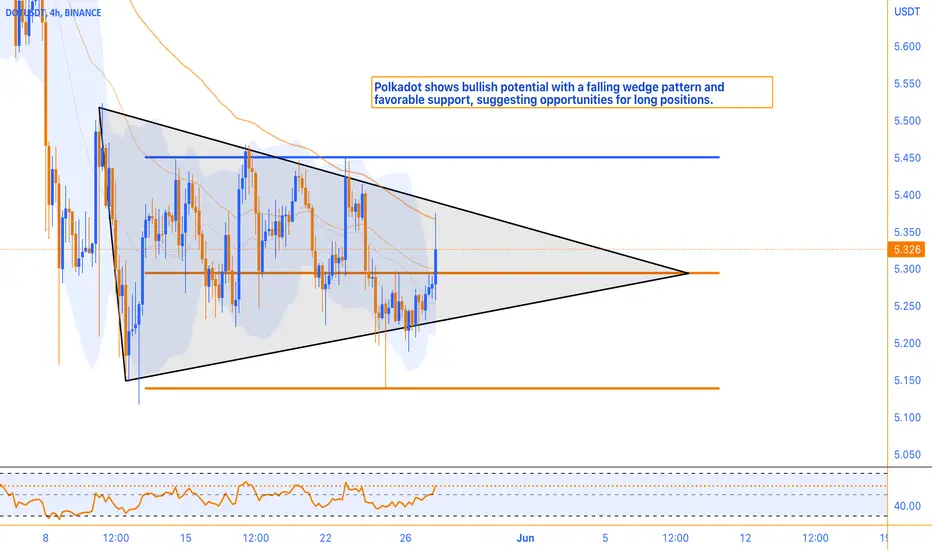
Polkadot is currently being traded within a significant support zone, presenting a favorable trading opportunity. On smaller timeframes, a falling wedge pattern has emerged, indicating the potential for an imminent breakout from this triangular formation. Moreover, the Relative Strength Index (RSI) is currently at the 58 level, suggesting moderate bullish momentum in the stock. This implies that buying pressure is stronger than selling pressure, yet it has not reached an overbought condition. With these factors in mind, traders can consider building a long position at the support level while implementing proper risk management techniques. This analysis indicates a potential upward movement in DOT's price in the near future.
Join our channel:
🔵 t.me/monocoin_public
🟠 t.me/monocoin_public
🔵 t.me/monocoin_public
🟠 t.me/monocoin_public
🔵 t.me/monocoin_public
🟠 t.me/monocoin_public
🔵 t.me/monocoin_public
🟠 t.me/monocoin_public
면책사항
이 정보와 게시물은 TradingView에서 제공하거나 보증하는 금융, 투자, 거래 또는 기타 유형의 조언이나 권고 사항을 의미하거나 구성하지 않습니다. 자세한 내용은 이용 약관을 참고하세요.