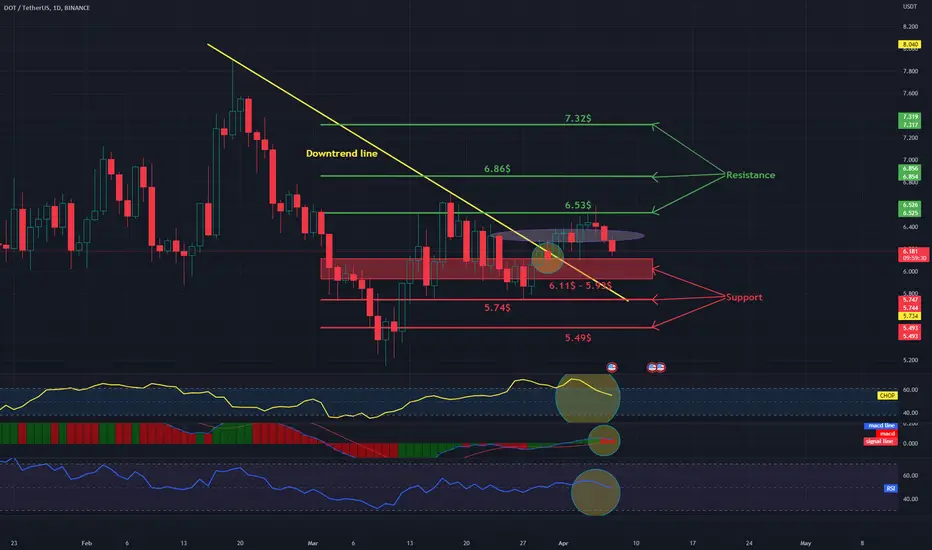
Hello everyone, I invite you to view the DOt/USDT chart on a one-day time frame.. First, we will use the yellow line to mark the downtrend line from which the price went up.
Moving on, we can move on to marking support areas when we start a larger correction. And here we see that the price is just below the first support, then we have a support zone from $6.11 to $5.93 in front of the price, third support at $5.74, and then fourth support at $5.49.
Looking the other way, we see first resistance at $6.53, then second resistance at $6.86, then third resistance at $7.32
Please look at the CHOP index, which indicates that we have a lot of energy for the upcoming move, the MACD indicates that we have entered an uptrend, while the RSI has left the downtrend.
면책사항
이 정보와 게시물은 TradingView에서 제공하거나 보증하는 금융, 투자, 거래 또는 기타 유형의 조언이나 권고 사항을 의미하거나 구성하지 않습니다. 자세한 내용은 이용 약관을 참고하세요.
면책사항
이 정보와 게시물은 TradingView에서 제공하거나 보증하는 금융, 투자, 거래 또는 기타 유형의 조언이나 권고 사항을 의미하거나 구성하지 않습니다. 자세한 내용은 이용 약관을 참고하세요.