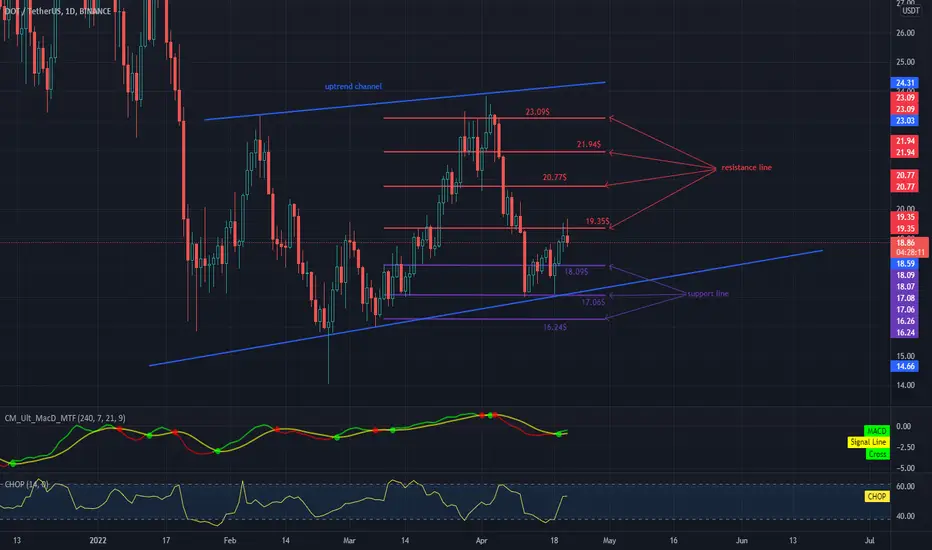
Hello everyone, let's take a look at the DOT to USDT chart over the 1 day timeframe. As you can see, the price is moving in an uptrend channel marked with blue lines.
Let's start by determining the support lines with the Trend-Based Fib Extension tool and as you can see, the first support in the near future is $ 18.09, if the support breaks down, the next ones are $ 17.06 and $ 16.24.
Now let's move from the resistance line as the first resistance is $ 19.35, if you can break it the next resistance will be $ 20.77 and $ 21.94 plus $ 23.09.
Looking at the CHOP indicator, we can see that in the 1-day range we are starting to gain more and more energy, and the MACD indicator shows that an uptrend has started.
면책사항
이 정보와 게시물은 TradingView에서 제공하거나 보증하는 금융, 투자, 거래 또는 기타 유형의 조언이나 권고 사항을 의미하거나 구성하지 않습니다. 자세한 내용은 이용 약관을 참고하세요.
면책사항
이 정보와 게시물은 TradingView에서 제공하거나 보증하는 금융, 투자, 거래 또는 기타 유형의 조언이나 권고 사항을 의미하거나 구성하지 않습니다. 자세한 내용은 이용 약관을 참고하세요.